Listen to this Blog
📊 AU Small Finance Bank Q4 & FY25 Results – Growth Anchored by Profitability & Prudent Risk Management
Date: 22nd April 2025
CMP: ₹613 | Market Cap Leader in Small Finance Banking
🏦 Key Financial Highlights
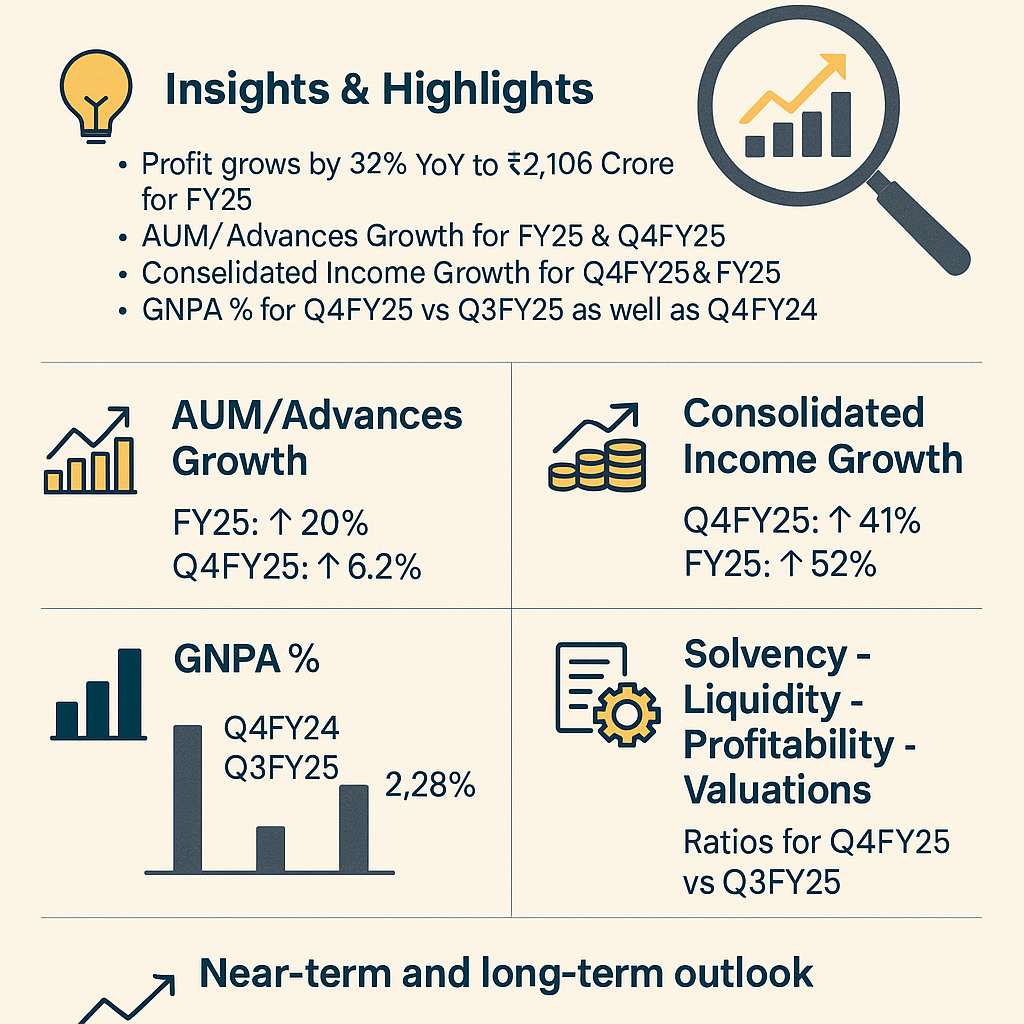
🔹 AUM/Advances Growth
Gross Loan Portfolio grew to ₹1,15,704 Cr (20% YoY | 6.2% QoQ).
Secured Portfolio (Retail + Commercial) expanded 25.3% YoY and 8.1% QoQ.
Unsecured Portfolio contracted by 17.6% YoY, reflecting conservative asset quality focus amidst sector-wide deleveraging.
🔹 Consolidated Income Growth
Net Interest Income (NII) surged by 55% YoY to ₹8,012 Cr in FY25 and by 57% YoY in Q4 to ₹2,094 Cr.
Other Income rose by 49% YoY in FY25 to ₹2,526 Cr and by 41% YoY in Q4 to ₹761 Cr.
Total Income for FY25 reached ₹18,590 Cr, up 52% YoY.
🔹 Profit Performance
FY25 PAT: ₹2,106 Cr (32% YoY growth)
Q4FY25 PAT: ₹504 Cr (18% YoY growth)
EPS: ₹28 for FY25 (up 19% YoY)
Book Value Per Share: ₹231 (up 23% YoY)
📉 Asset Quality Snapshot
The bank demonstrated prudent provisioning with an additional ₹150 Cr set aside in Q4FY25 to further strengthen buffers, primarily for unsecured exposures.
📌 Key Operating Metrics
NIM: 5.94% for FY25 vs. 5.45% in FY24 | Q4 NIM at 5.8%
RoA: 1.5% for FY25 | Q4 RoA at 1.4%
RoE: 13.1% for FY25 | Q4 RoE at 11.9%
Cost to Income Ratio: Improved to 57% in FY25 (vs. 64% in FY24) | Q4 at 55%
Liquidity Coverage Ratio (LCR): Healthy at 116%
🧮 Solvency, Liquidity, Profitability & Valuations (CMP ₹613)
🌐 Industry KPIs vs. AU Bank Performance
AU Bank’s high RoA model and leaner operations are positioning it above the peer average in profitability, despite macro headwinds.
🔭 Outlook: Near Term & Long Term
Near-Term View (FY26):
Margins may moderate slightly due to rising cost of funds.
Risk-controlled growth likely in secured books.
Further integration of Fincare business to add scale with cost synergies.
Long-Term View (Vision 2027):
Strategic portfolio shift towards high-RoA segments to continue (~73% already achieved).
Digital innovation (AU Ivy, AU Eternity, AU Udyogini) to enhance cross-sell and fee income.
AU Bank is building resilience with a strong capital base, diversified product suite, and robust liquidity management.
📝 Disclosure
This blog post is for informational purposes only. It does not constitute investment advice or a recommendation. Investors must exercise their own judgment before investing. AU Bank's performance data are derived from publicly available documents including investor presentations, press releases, and financial results.


.jpg)


