Listen to this Blog
Affle 3i Limited (formerly Affle India Ltd) has announced its audited financial results for the quarter and full year ended March 31, 2025. The company continues its momentum in the global adtech space, driven by its CPCU (Cost Per Converted User) model and AI-led marketing innovation.
🏢 Company Snapshot
-
Name: Affle 3i Limited
-
Sector: Digital Advertising Technology
-
Business Model: CPCU (Cost per Converted User)
-
Key Markets: India & Emerging Markets (72.8%), Developed Markets (27.2%)
-
CMP: ₹3019
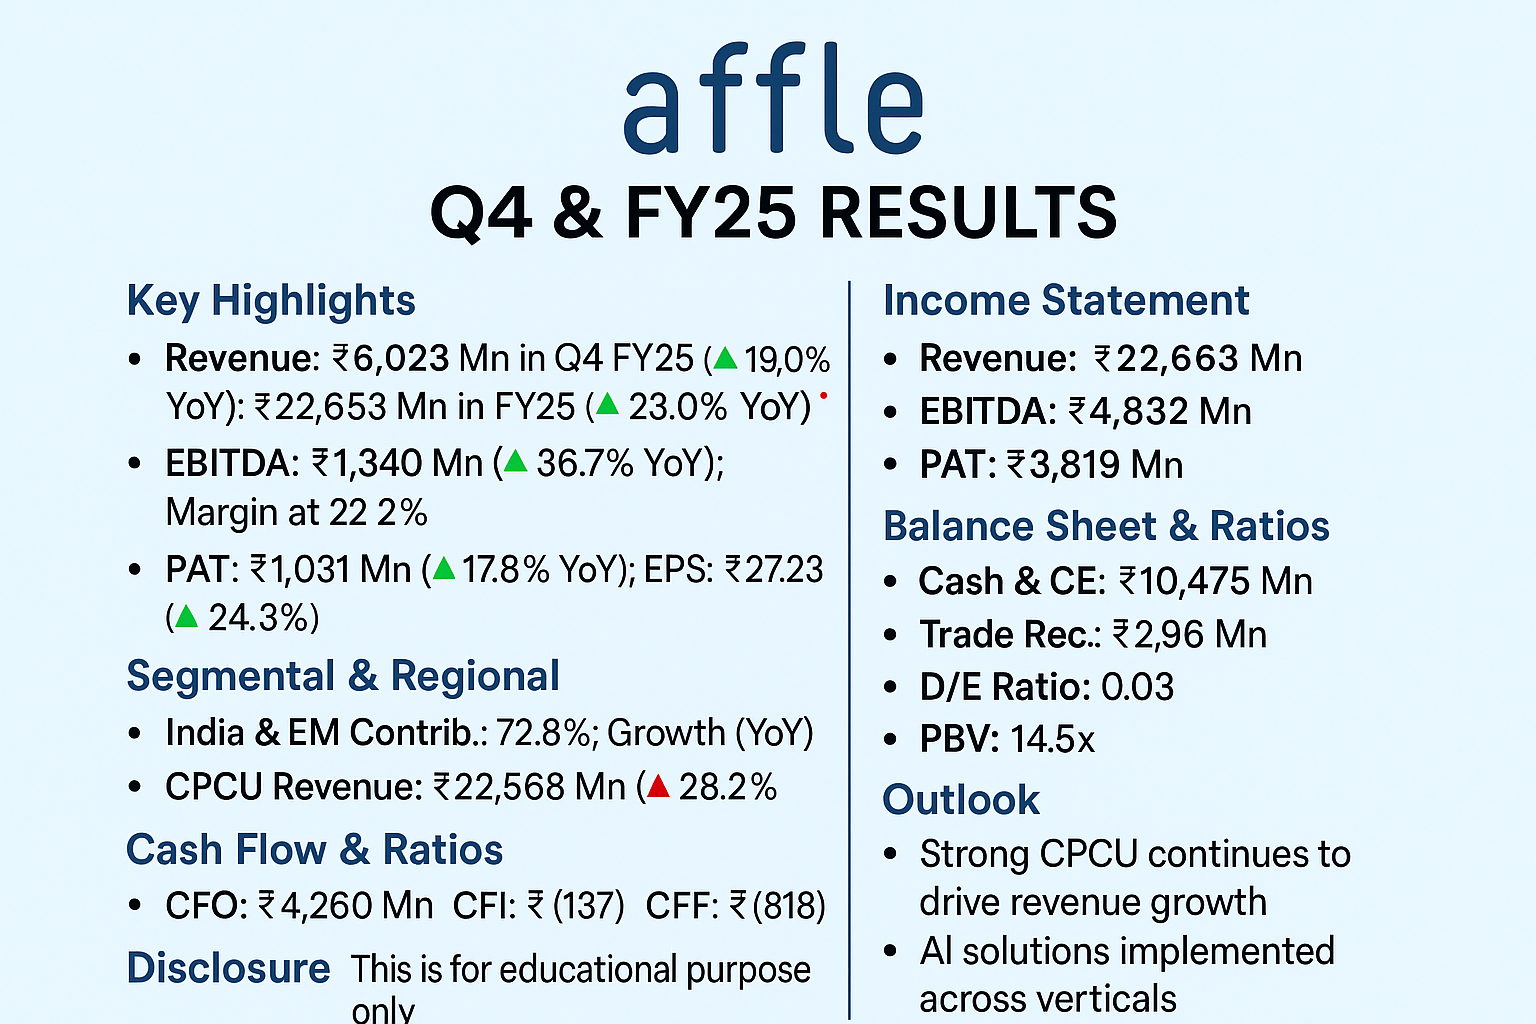
📈 Key Financial Highlights – Q4 FY25 & FY25
| Metric | Q4 FY25 | Q4 FY24 | YoY Growth | FY25 | FY24 | YoY Growth |
|---|---|---|---|---|---|---|
| Revenue (₹ Mn) | 6,023 | 5,062 | 🟢 +19.0% | 22,663 | 18,428 | 🟢 +23.0% |
| EBITDA (₹ Mn) | 1,340 | 980 | 🟢 +36.7% | 4,832 | 3,600 | 🟢 +34.2% |
| PAT (₹ Mn) | 1,031 | 875 | 🟢 +17.8% | 3,819 | 2,973 | 🟢 +28.5% |
| EBITDA Margin (%) | 22.2% | 19.4% | 🟢 +280 bps | 21.3% | 19.5% | 🟢 +180 bps |
| EPS (₹) – Basic | 7.35 | 6.45 | 🟢 +13.9% | 27.23 | 21.91 | 🟢 +24.3% |
| Tax Expense (₹ Mn) | 208 | 127 | 🔴 +64.2% | 858 | 295 | 🔴 +190.4% |
🧠 Strategic Highlights
-
Renamed as Affle 3i to represent Innovation, Impact & Intelligence.
-
Deployed 100+ AI agents across functions to boost productivity.
-
Launched CTV.ai and self-serve ad platforms to scale operations.
-
Focus on verticalized growth: E-commerce, Fintech, FoodTech, Gaming etc.
🌍 Segment & Geography Performance
-
India & Emerging Markets Revenue: 🟢 +15.9% YoY
-
Developed Markets Revenue: 🟢 +27.3% YoY
-
Conversions (CPCU model): 392.8 Mn in FY25 (🟢 +25.6% YoY)
-
CPCU Revenue: ₹22,568 Mn (🟢 +28.2% YoY)
📊 Consolidated Income Statement Summary
| Particulars | Q4 FY25 | FY25 | Q4 FY24 | FY24 |
|---|---|---|---|---|
| Revenue from Operations | 6,023 | 22,663 | 5,062 | 18,428 |
| Other Income | 189 | 938 | 273 | 572 |
| Total Income | 6,212 | 23,601 | 5,335 | 19,000 |
| Total Expenses | 4,973 | 18,924 | 4,333 | 15,732 |
| Profit Before Tax | 1,239 | 4,676 | 1,002 | 3,268 |
| Profit After Tax | 1,031 | 3,819 | 875 | 2,973 |
🟢 Growth in both topline and bottom line supported by operating leverage.
📘 Balance Sheet Highlights – FY25
| Metric | FY25 | FY24 |
|---|---|---|
| Equity Share Capital | ₹280.71 Mn | ₹280.21 Mn |
| Total Equity | ₹29,464.57 Mn | ₹24,980.40 Mn |
| Total Assets | ₹36,217.70 Mn | ₹32,830.83 Mn |
| Total Liabilities | ₹6,753.13 Mn | ₹7,850.03 Mn |
| Cash & Cash Equivalents | ₹10,474.81 Mn | ₹8,051.01 Mn |
| Trade Receivables | ₹2,985.56 Mn | ₹3,173.64 Mn |
| PBV (at CMP ₹3019) | ~14.52x | ~17.14x |
| Debt-to-Equity Ratio | 🟢 0.03x | 🟢 0.04x |
| Current Ratio | 🟢 3.22 | 🟢 2.51 |
✅ Strong liquidity and low leverage profile maintained.
💸 Cash Flow Summary (₹ in Mn)
| Particulars | FY25 | FY24 |
|---|---|---|
| Cash Flow from Operations | 🟢 4,259.91 | 🟢 2,622.76 |
| Investing Activities | 🔴 (137.12) | 🔴 (5,772.90) |
| Financing Activities | 🔴 (818.13) | 🟢 783.19 |
| Net Cash Flow | 🟢 2,204.66 | 🟢 4,631.78 |
| Free Cash Flow (Est.) | 🟢 2,660.89 | 🟢 1,466.46 |
🔮 Outlook & Growth Strategy
📌 Near-Term:
-
Continued growth in India and developed markets via performance marketing.
-
AI integration to enhance personalization and ad delivery.
🌟 Long-Term:
-
Focus on 10x decadal growth, driven by GenAI, new verticals, and CPCU expansion.
-
Increasing margin efficiencies and market leadership in adtech.


.jpg)


