Listen to this Blog
🔋 Amara Raja Batteries Q4 FY25 & FY25 Results: Energizing the Future with EV Vision But Profits in fall
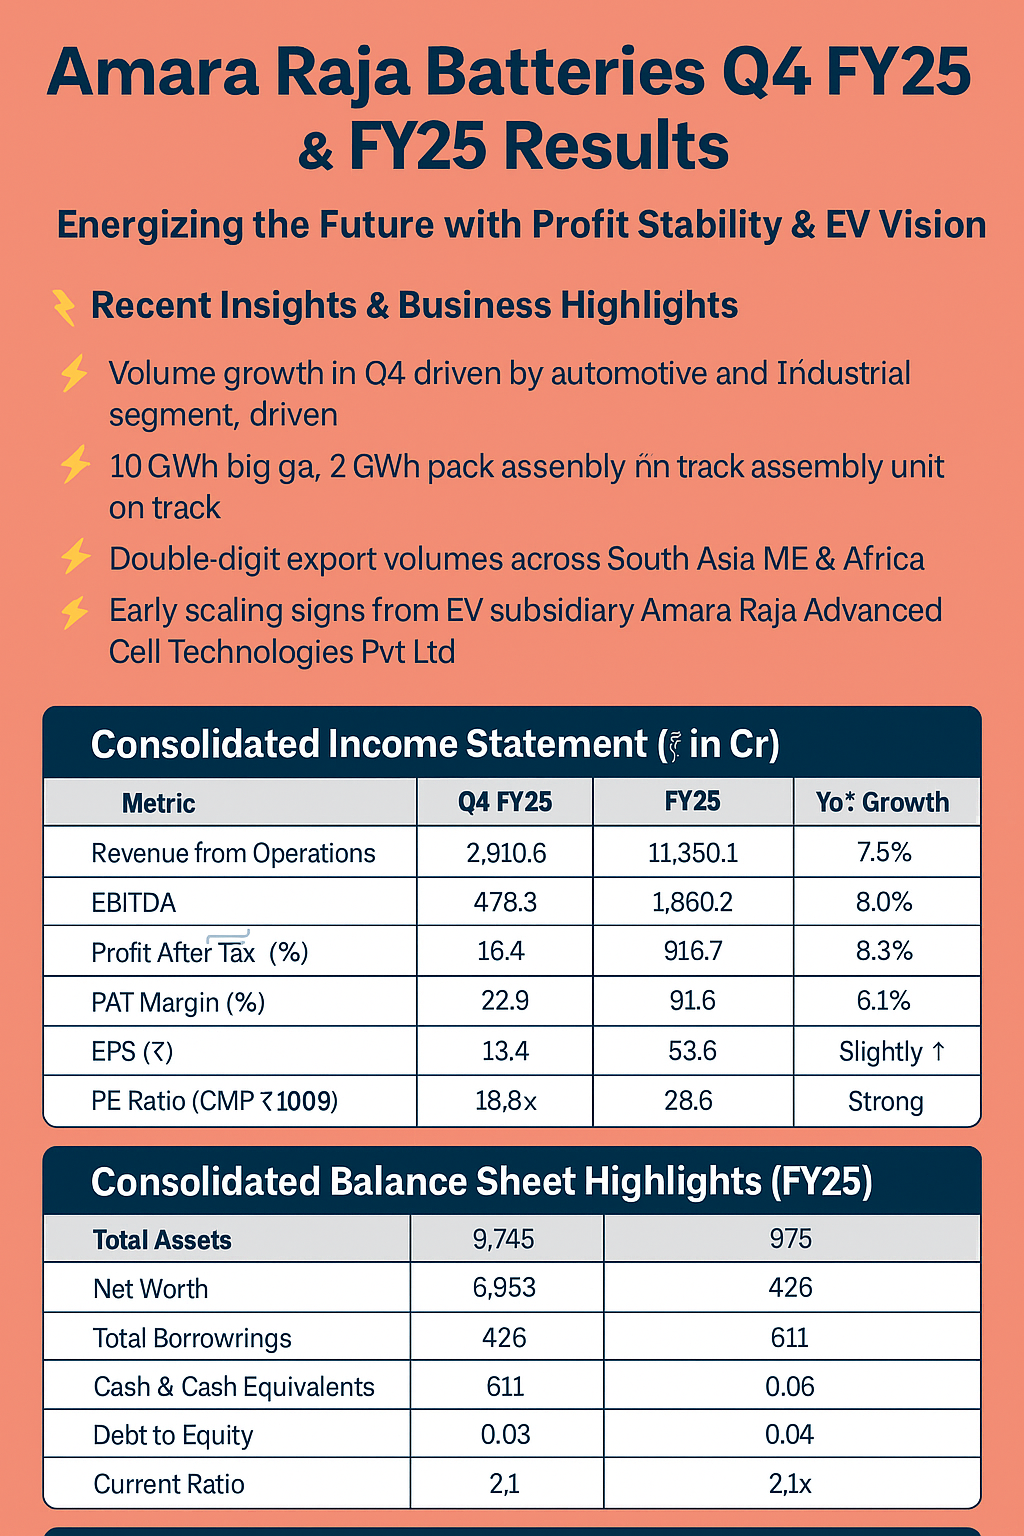
🔍 Recent Insights & Business Highlights
Volume Growth: Q4 witnessed strong traction in both automotive and industrial segments, driven by export demand and OEM recovery.
New Energy Push: Lithium-ion giga factory (10 GWh) and pack assembly unit (2 GWh) remain on track—marking Amara Raja’s EV transition.
Export Expansion: Double-digit growth in export volumes; widening distribution network across emerging markets in South Asia, Middle East & Africa.
EV Subsidiary: Amara Raja Advanced Cell Technologies Pvt Ltd shows early signs of scaling.
📊 Consolidated Income Statement (₹ in Cr)
🧾 Consolidated Balance Sheet Highlights (FY25)
💰 Consolidated Cash Flow Snapshot (FY25)
🌐 Segmental & Regional Performance
Automotive Batteries: Volume growth led by strong replacement market and OEM revival.
Industrial Batteries: Sustained telecom & UPS segment demand.
Geographic Mix: ~22% of revenue from exports; Middle East & Africa growing rapidly.
🔮 Outlook – Short Term & Long Term
Near-Term:
Margins may face input cost pressure; however, export volumes and OEM recovery to support top line.
Channel expansion and product mix to help maintain profitability.
Long-Term:
Growth aligned with India’s EV and energy storage story.
Giga-factory progress and cell manufacturing capabilities to create value beyond FY26.
📢 Disclosure
This blog is intended purely for educational and informational purposes and does not constitute financial advice or a recommendation. Investors are encouraged to perform their own research before making investment decisions.


.jpg)


