Listen to this Blog
🏥 Apollo Hospitals FY25 Results: Strong Performance Backed by Expansion Plans
📅 Date: May 30, 2025
✍️ Author: Piyush Patel
🔍 CMP: ₹6,875 | Sector: Healthcare Services
📌 Executive Summary
Apollo Hospitals Enterprise Ltd., India’s leading integrated healthcare provider, delivered an impressive performance in FY25 with strong earnings growth, margin expansion, and accelerated capacity expansion across metros. With over ₹7,600 crore earmarked for hospital projects and a strategic push in digital health, Apollo continues to reinforce its leadership.
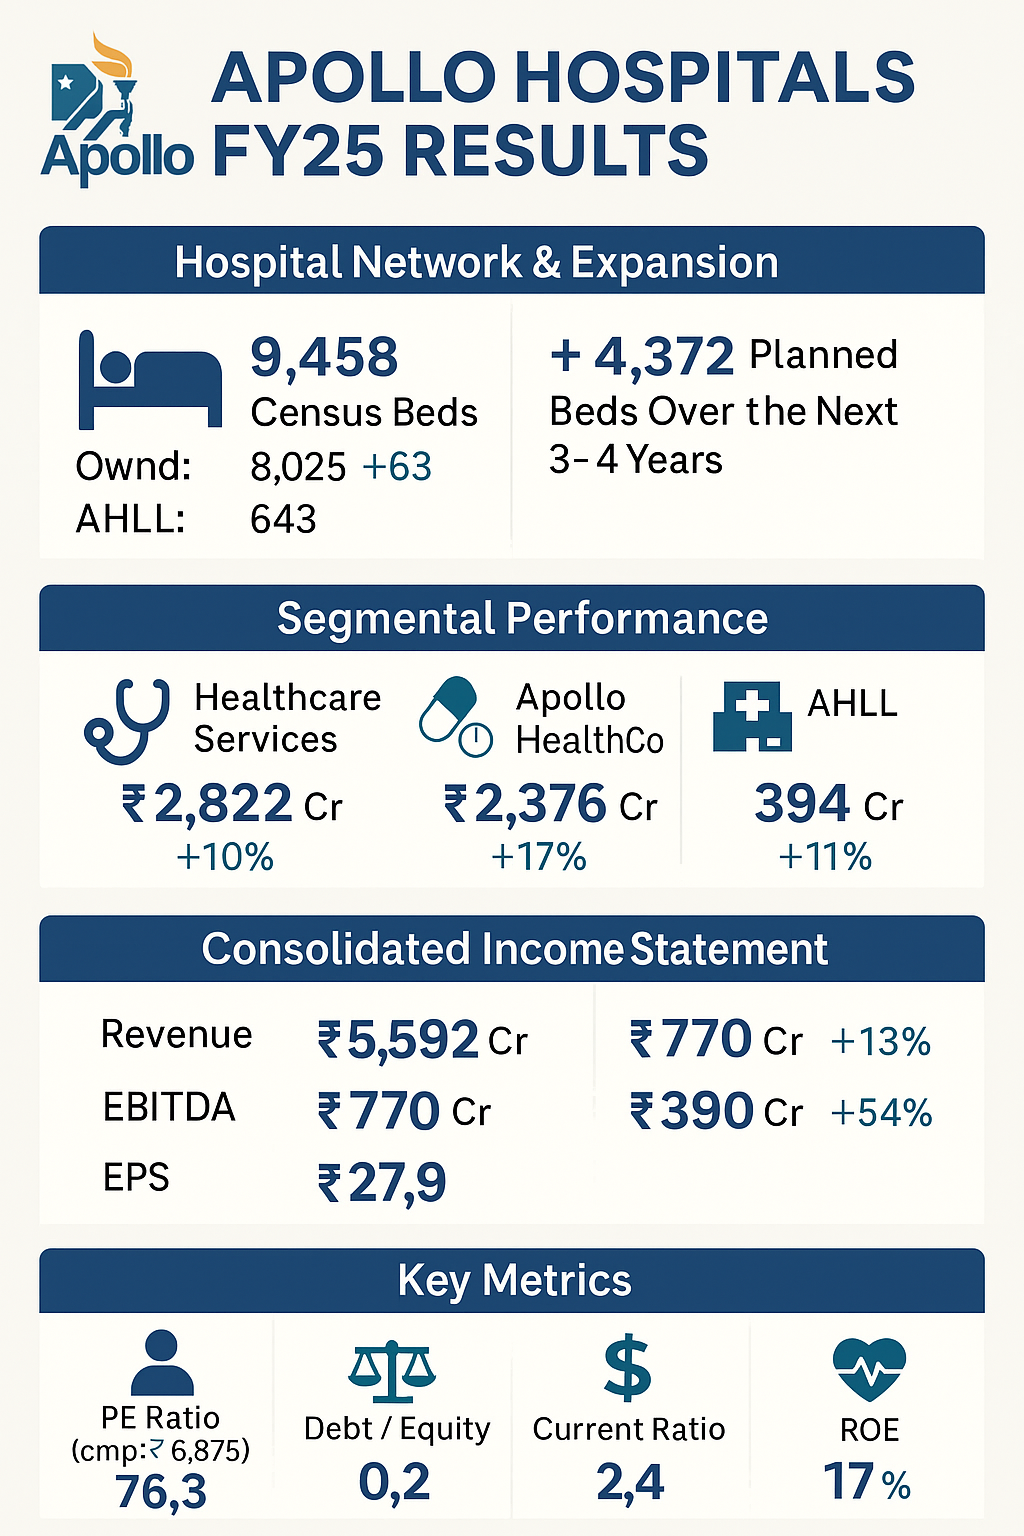
🏨 Hospital Network & Expansion Strategy
Total Census Beds (as of March 2025):
Owned: 8,025
O&M: 790
AHLL (Day Surgery & Birthing): 643
Total: 9,458 beds
Occupancy Rate (FY25):
68% overall | 71% in Metros
Planned Expansion (Next 3–4 Years):
🏗️ 4,372 New Beds (3,577 census beds)
🏙️ Key Cities: Sarjapur, Chennai, Varanasi, Worli, Lucknow
💰 ₹7,603 Cr investment (₹5,521 Cr pending)
📊 Segmental Performance (Q4 FY25 & FY25)
📈 Consolidated Income Statement Summary
📊 Valuation & Key Ratios (at CMP ₹6,875)
📘 Consolidated Balance Sheet Snapshot (₹ Cr)
💰 Cash Flow Statement Summary (₹ Cr)
🔮 Strategic Highlights & Near-Term Outlook
✅ Expansion into Bengaluru’s Sarjapur market with a 700-bed integrated facility
✅ Strategic MoUs & innovations in telehealth, diagnostics, and digital pharmacy
✅ Occupancy trends improving across metros; ARPOB at ₹63,569/day
🔭 Outlook FY26–FY30
Apollo Hospitals is well-positioned to benefit from:
India’s rising healthcare demand
Institutional trust in its clinical excellence
Digital penetration via Apollo 24|7 and pharmacy chains
However, high valuations (PE ~76x) and aggressive CAPEX may weigh in the short term.
📢 Final Dividend Update
₹10/share Final Dividend (200%)
Total FY25 Dividend: ₹19/share (₹2,731.9 million payout)
Record Date: August 19, 2025 | Payout by: September 10, 2025
📌 Disclosure
This blog is prepared solely for educational and informational purposes and does not constitute investment advice or stock recommendation. Readers are advised to do their own research before making any financial decisions.


.jpg)


