Listen to this Blog
Asian Paints Q4 FY25 Financial Analysis: Detailed Investor Insights
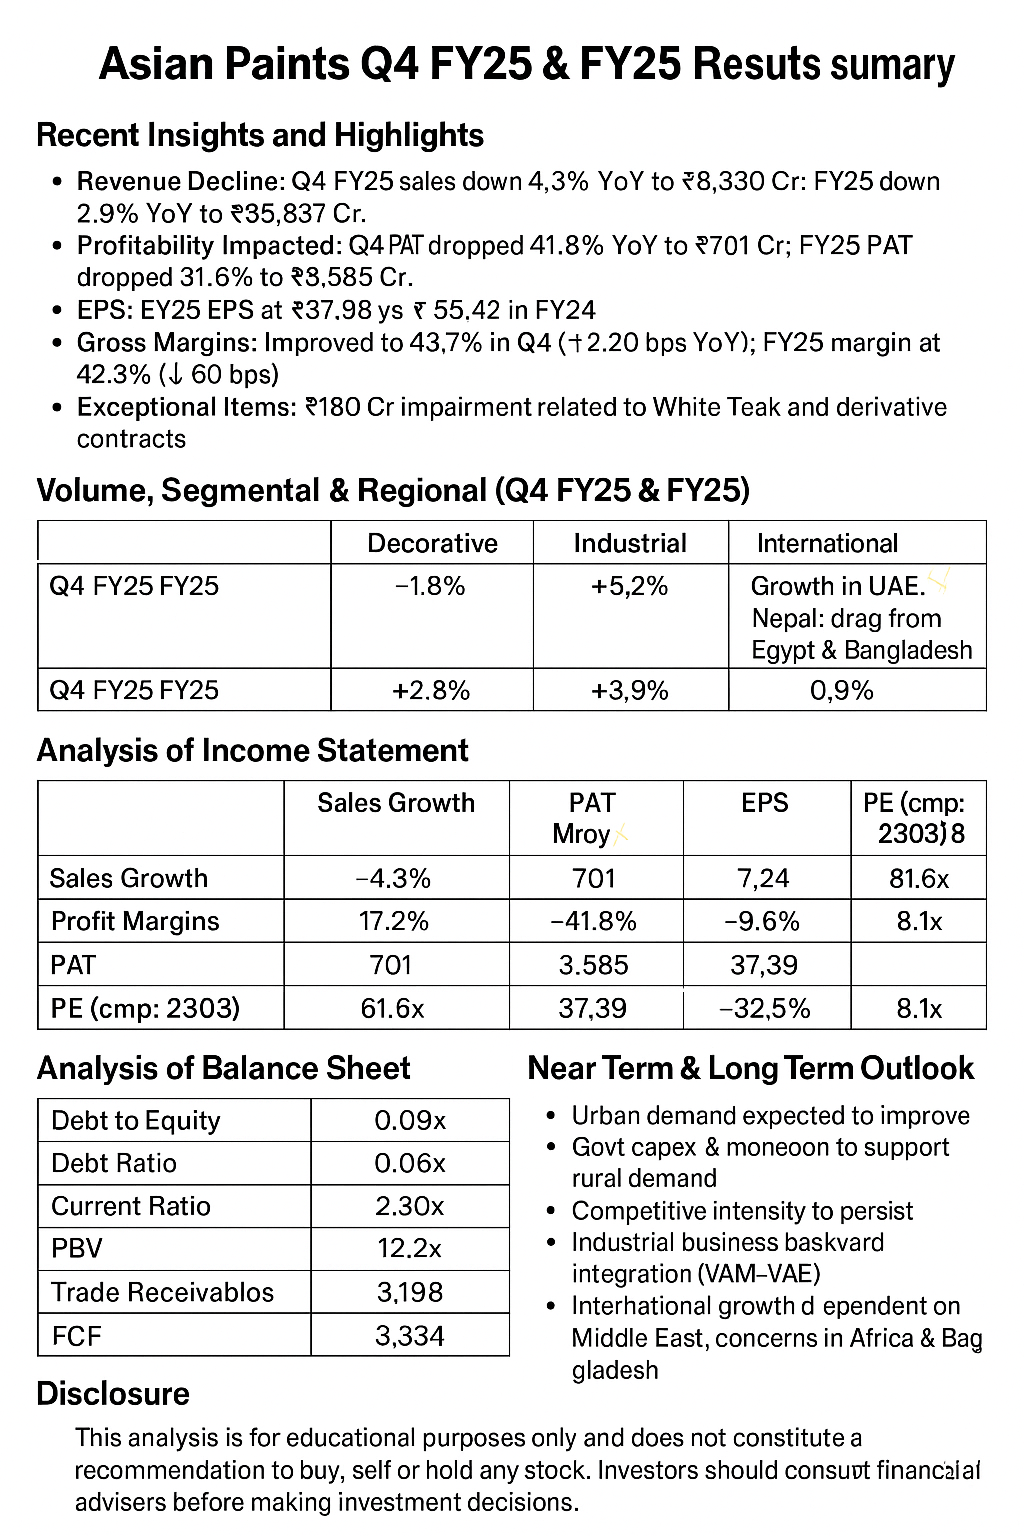
1. Recent Insights and Highlights
Revenue Decline: Net sales declined by 4.3% YoY for Q4 FY25, primarily due to subdued growth in the domestic decorative segment and international business, while the industrial segment performed better.
Gross Margins: The gross margin for Q4 FY25 improved slightly to 43.7% from 43.0% in Q4 FY24, primarily due to material price deflation and formulation efficiencies.
Profitability: Profit Before Tax (PBT) for Q4 FY25 stood at ₹1,205 crore, down from ₹1,324 crore in Q4 FY24.
Net Profit: Net Profit for Q4 FY25 was ₹701 crore, a significant decline from ₹1,205 crore in Q4 FY24.
Dividend Announcement: The company declared a final dividend of ₹20.55 per share, taking the total dividend for FY25 to ₹24.80 per share.
2. Volume, Segmental & Regional Performance (Q4 FY25 & FY25)
3. Consolidated Income Statement (₹ in Crores)
4. Balance Sheet Analysis (₹ in Crores)
5. Cash Flow Analysis (₹ in Crores)
6. Near-Term & Long-Term Outlook
Near-Term: Demand is expected to improve in urban areas, supported by a normal monsoon forecast and government spending in rural areas.
Competitive Intensity: The company anticipates high competitive intensity, necessitating a strong focus on brand strength.
Innovation & Expansion: Continued focus on innovation in product categories and expanding the distribution network.
Industrial Business Growth: Expected to maintain growth momentum.
International Markets: Growth in the Middle East is expected to continue, while Asia and Africa may face challenges due to macroeconomic factors.
7. Disclosure
This analysis is for educational purposes and does not constitute a recommendation to buy, sell, or hold any stock.
Investors are advised to conduct their own research before making any investment decisions.


.jpg)


