Listen to this Blog
🚜 Balkrishna Industries Ltd – Q4 & FY25 Results Update: Strong Long-Term Strategy Despite Soft Q4
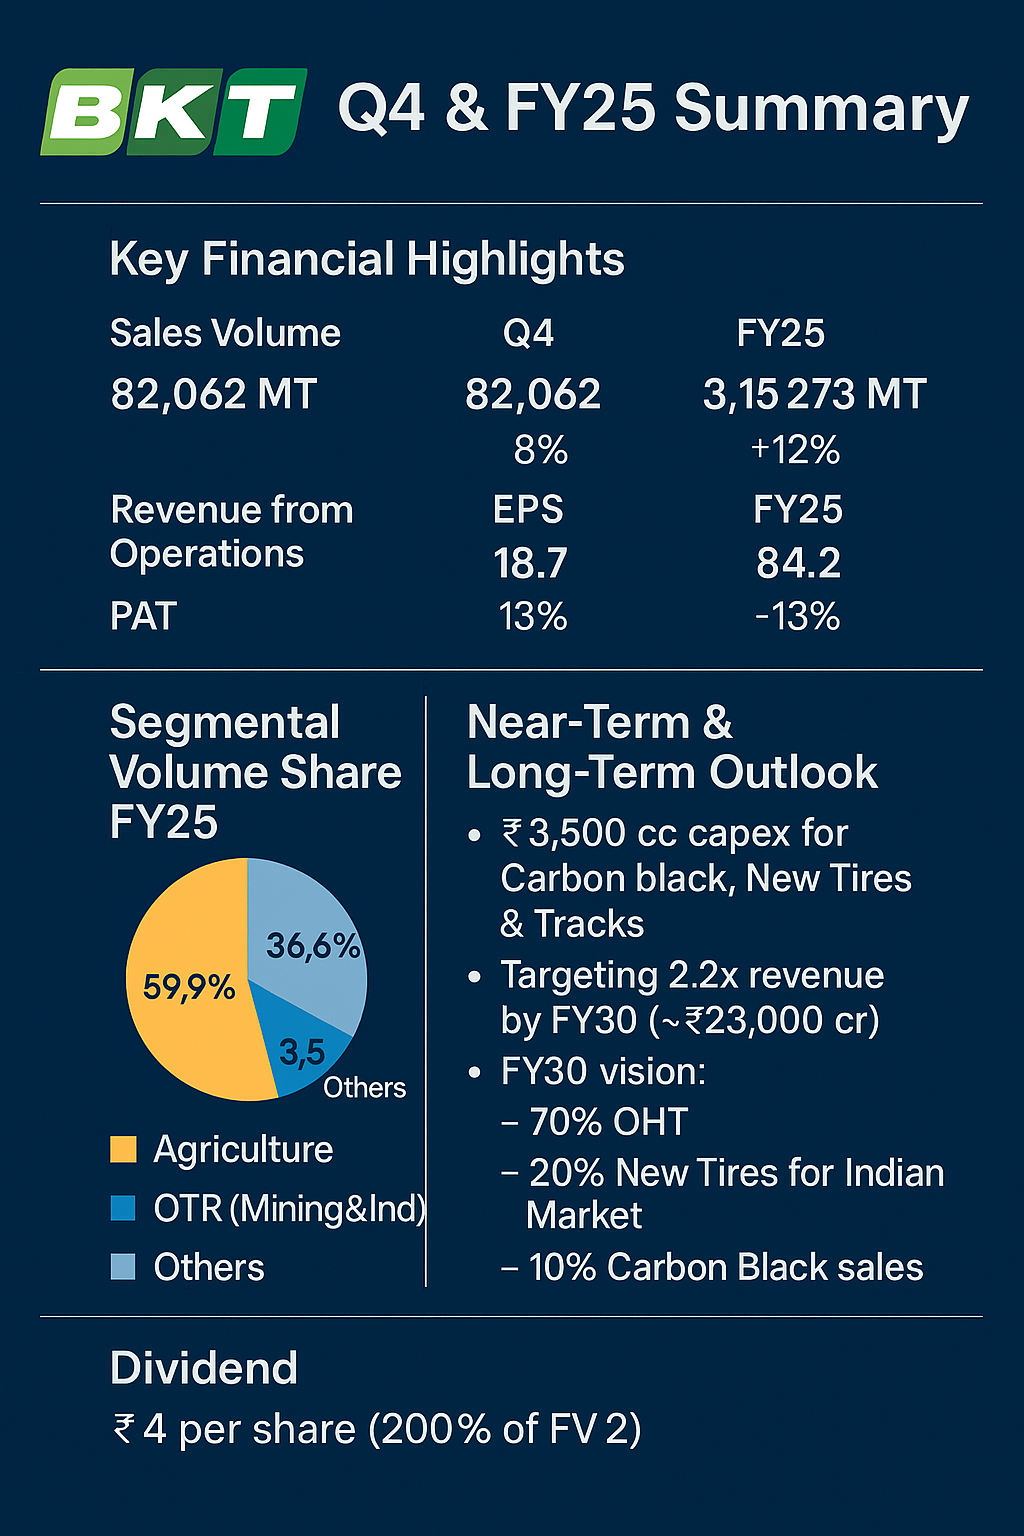
📊 Key Financial Highlights
📉 Q4 PAT dropped due to higher depreciation, interest, and unrealized forex losses.
📦 Segmental, Channel & Regional Volume Share (FY25)
📈 Key Ratios & Metrics (Consolidated)
📘 Consolidated Balance Sheet Summary (₹ Cr)
💰 Consolidated Cash Flow Statement (₹ Cr)
🔭 Near-Term & Long-Term Outlook
🛠️ Expansion Projects
₹3,500 Cr capex over 3 years for:
Carbon black expansion to 360,000 MTPA
New categories: Commercial Vehicle & Passenger Radial Tires
Track systems & De-bottlenecking
Targeting 2.2x revenue by FY30 (~₹23,000 Cr)
FY30 vision:
70% OHT
20% New Tires for Indian Market
10% Carbon Black sales
📌 Outlook
Near-term profitability may stay muted due to capex, higher depreciation, and forex volatility.
Strong long-term visibility with product diversification and global OEM expansion.
Resilient business model with surplus cash and strategic cost control.
📢 Final Dividend
₹4 per share (200% of FV ₹2)
Total FY25 dividend: ₹16 per share
📌 Disclosure
This analysis is for educational and informational purposes only and does not constitute a buy/sell recommendation.


.jpg)


