Listen to this Blog
First advance estimates from the National Accounts Division for the fiscal year 2024-25:
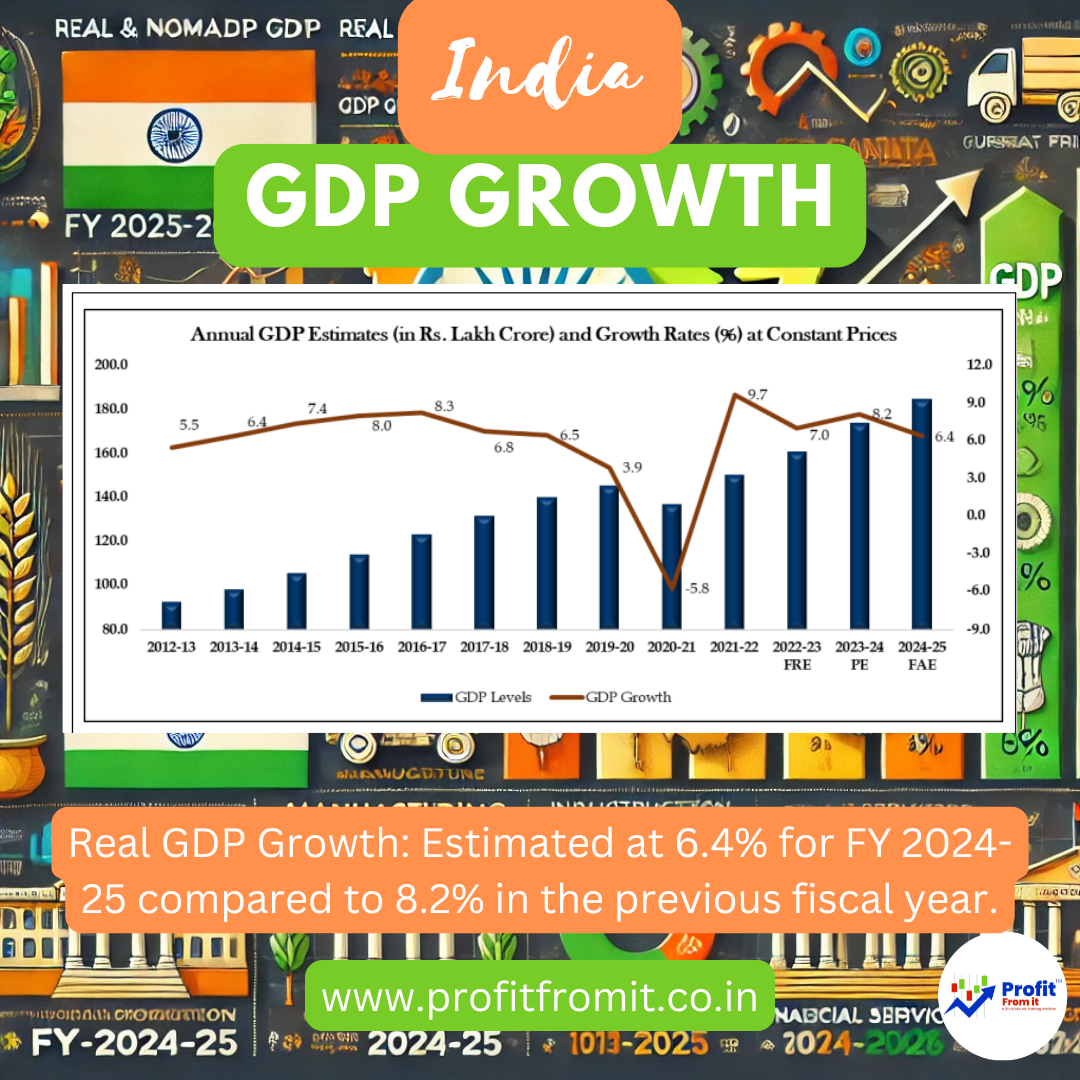
1. GDP Growth: Real and Nominal
Real GDP Growth: Estimated at 6.4% for FY 2024-25 compared to 8.2% in the previous fiscal year. 📈 This is the 4 Years Lowest growth we saw affecting Profits and taking the stock market into correction from rally mode.
Nominal GDP Growth: Estimated at 9.7% for FY 2024-25, a slight increase from 9.6% in FY 2023-24. 📊 The growth of 9.7% takes Indian GDP to the boom 324.1 Lakh Cr v/s 270 Lakh Cr we saw in 2022-23. Such an increase was supposed to help reach 4 Trillion USD Indian GDP in dollar terms, but appreciation of USD will hit this math and restrict to somewhere 3.8 to 3.9 Trillion USD.
2. GDP Per Capita Growth at Current Prices
The per capita GDP at current prices has grown by 8.7%, increasing from ₹1,94,879 in FY 2022-23 to ₹2,30,195 in FY 2024-25. 💹 Such an increase could help boost consumption and discretionary spending.
3. Industry Contribution and Growth
Agriculture, Livestock, Forestry, & Fishing: Estimated real GVA growth of 3.8% in FY 2024-25, up from 1.4% in the previous year. 🌾This boost could help lower inflation further.
Manufacturing: Real GVA growth is estimated at 5.3% in FY 2024-25 which is weak v/s last year growth of 9.9% due to weaker global scenario combined with weak domestic consumption. 🏭
Construction: Experiencing a substantial increase with an 8.6% growth rate in real GVA which was weaker than the previous year with the growth of 9.9%. 🏗️
Financial, Real Estate & Professional Services: Estimated to grow by 7.3% in real terms v/s last year 8.4%. 🏦
Public Administration, Defence & Other Services: These services are showing strong growth with an estimated real GVA increase of 9.1% v/s last year 7.8%. 🛂
4. Main Indicators Influencing Sector Growth
Agricultural Output: Growth in major crops and livestock products is a significant indicator for the agricultural sector. 🌱Growth in Rice Production is strong 5.9%.
Industrial Production: The Index of Industrial Production (IIP) data, reflecting the manufacturing sector's performance. ⚙️
Construction Activity: Indicated by data on cement production and steel consumption. 🧱 Cement growth seems to be weak by just 3.1% growth while Cements growth was strong by 12.3%.
Service Sector Performance: Indicated by data such as bank deposits and credits, passenger and cargo traffic in transport sectors, and revenue from services in financial and real estate sectors. 📉 Air Passenger growth of 8.5% while Rail Passenger growth of 6.6% both seems to be strong. Bank deposit and Credit growth is expected to grow by 11.9% and 13.1% which is again good.
Expected Impacts on Returns in the Stock Market
The growth in these key sectors suggests a varied impact on the stock market:
Stable Growth in Agriculture and Manufacturing: Likely to bolster related stocks, especially in agro-based and industrial sectors. 📊
Strong Growth in Construction and Services: This could be beneficial for companies in these sectors, indicating potential good returns for investors in related stocks. 🚧
Overall Economic Stability: The relatively stable economic growth rates and sectoral performances suggest a cautiously optimistic outlook for the broader market, supporting diversified investment strategies. 🌍
World is assumed to grow by 3.2% during the same time. Yes India is outperforming the world and developing as well as developing Economies. But at the same time the bar is below India’s actual performance.
This data provides a comprehensive overview to aid investment decisions in the Indian stock market, reflecting current economic conditions and growth expectations.


.jpg)


