Listen to this Blog
📊 Industrial Production in India – February 2025 Snapshot
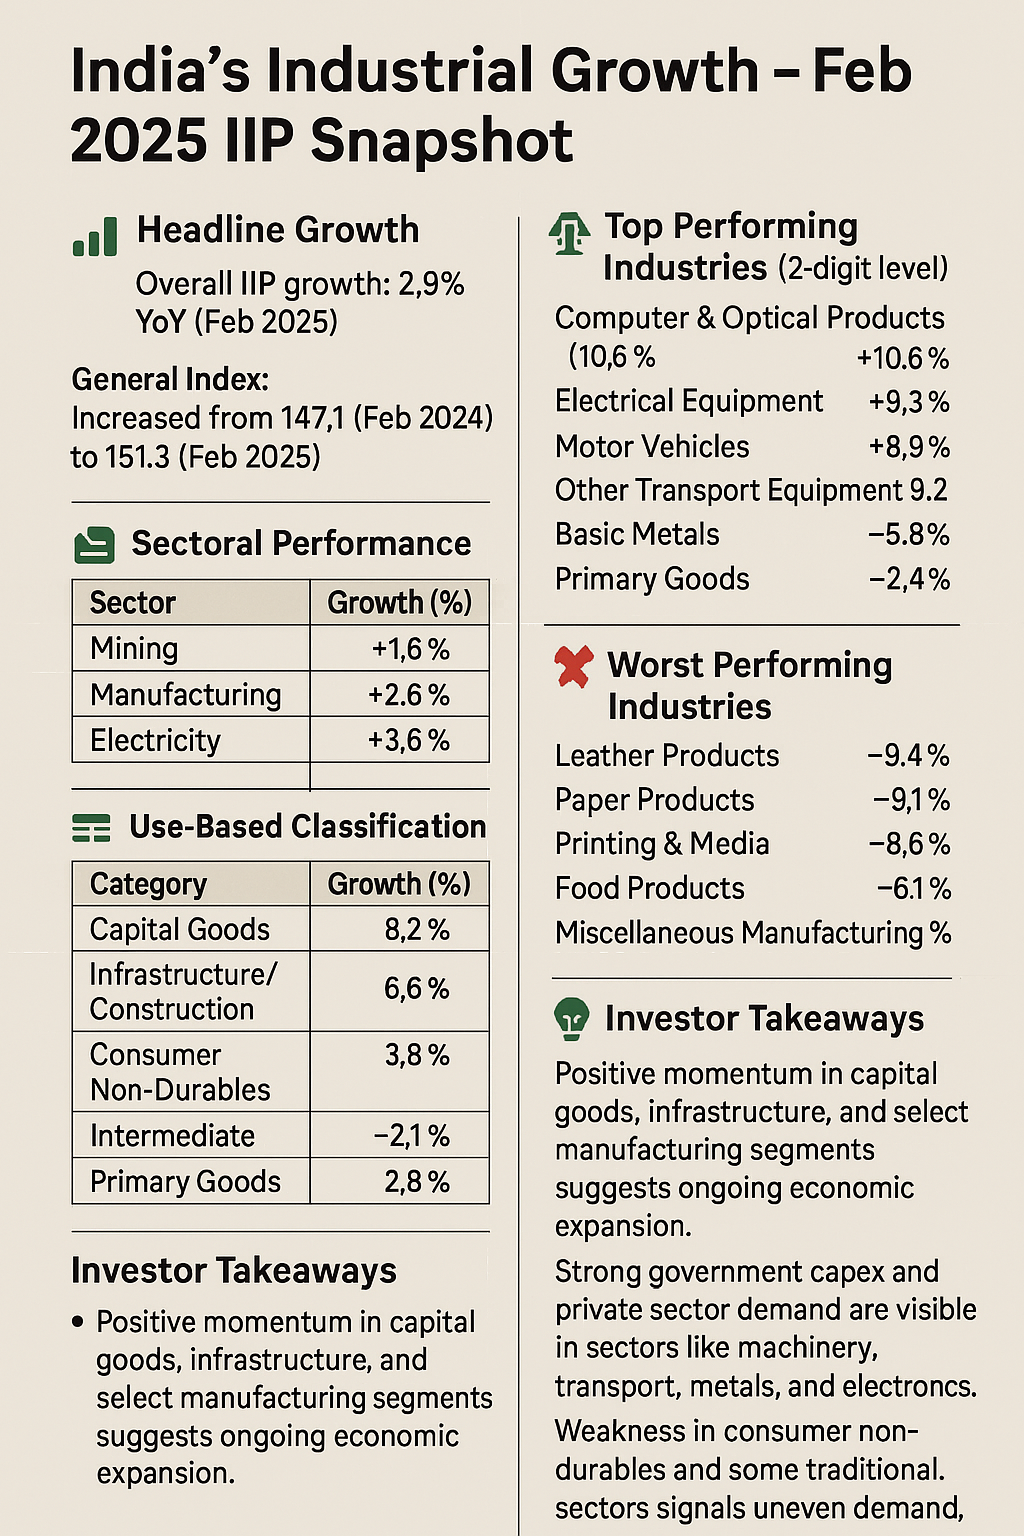
🔍 Key Highlights
Overall IIP growth stood at 2.9% in February 2025 compared to 5.0% in January 2025.
The General Index rose to 151.3 in Feb 2025 from 147.1 in Feb 2024.
Sectoral growth:
Mining: +1.6%
Manufacturing: +2.9%
Electricity: +3.6%
📈 Sectoral Trend (YoY)
Manufacturing continues to dominate the IIP composition, with the highest weight (77.6%).
🏭 2-Digit Industry Growth – Top & Bottom Performers
🥇 Top Performing Industries (YoY Feb 2025):
❌ Worst Performing Industries:
🧰 Use-Based Classification – Growth Analysis
🧠 How Should Investors Interpret This?
Moderate IIP Growth: While Feb's IIP growth (2.9%) is lower than Jan's (5.0%), the trend still signals economic activity, especially in capital-intensive sectors.
Manufacturing Momentum: Key industrial sectors (autos, metals, electronics) show healthy momentum, indicating selective investment opportunities.
Infra Play: Capital goods and infrastructure goods categories grew over 6%, signaling government capex and housing boom are still strong levers.
Watch Consumer Non-Durables: A decline suggests cautious consumer sentiment or rural slowdown. FMCG investors should be watchful.
Look Beyond Headlines: Sectoral and 2-digit industry analysis is more important than the headline number. Investors can target outperforming micro-sectors.
📌 Conclusion
The IIP for February 2025 reinforces India's multi-speed industrial recovery. While headline growth is slower, the underlying strength in capital goods, infrastructure, and specific manufacturing segments is a bullish signal for long-term investors. Focus on sector rotation, align with government spending trends, and watch for cyclical plays in electronics, auto, and capital goods.


.jpg)


