Listen to this Blog
🚗 Indian Auto Industry - February 2025 Report: Investor Insights 📊
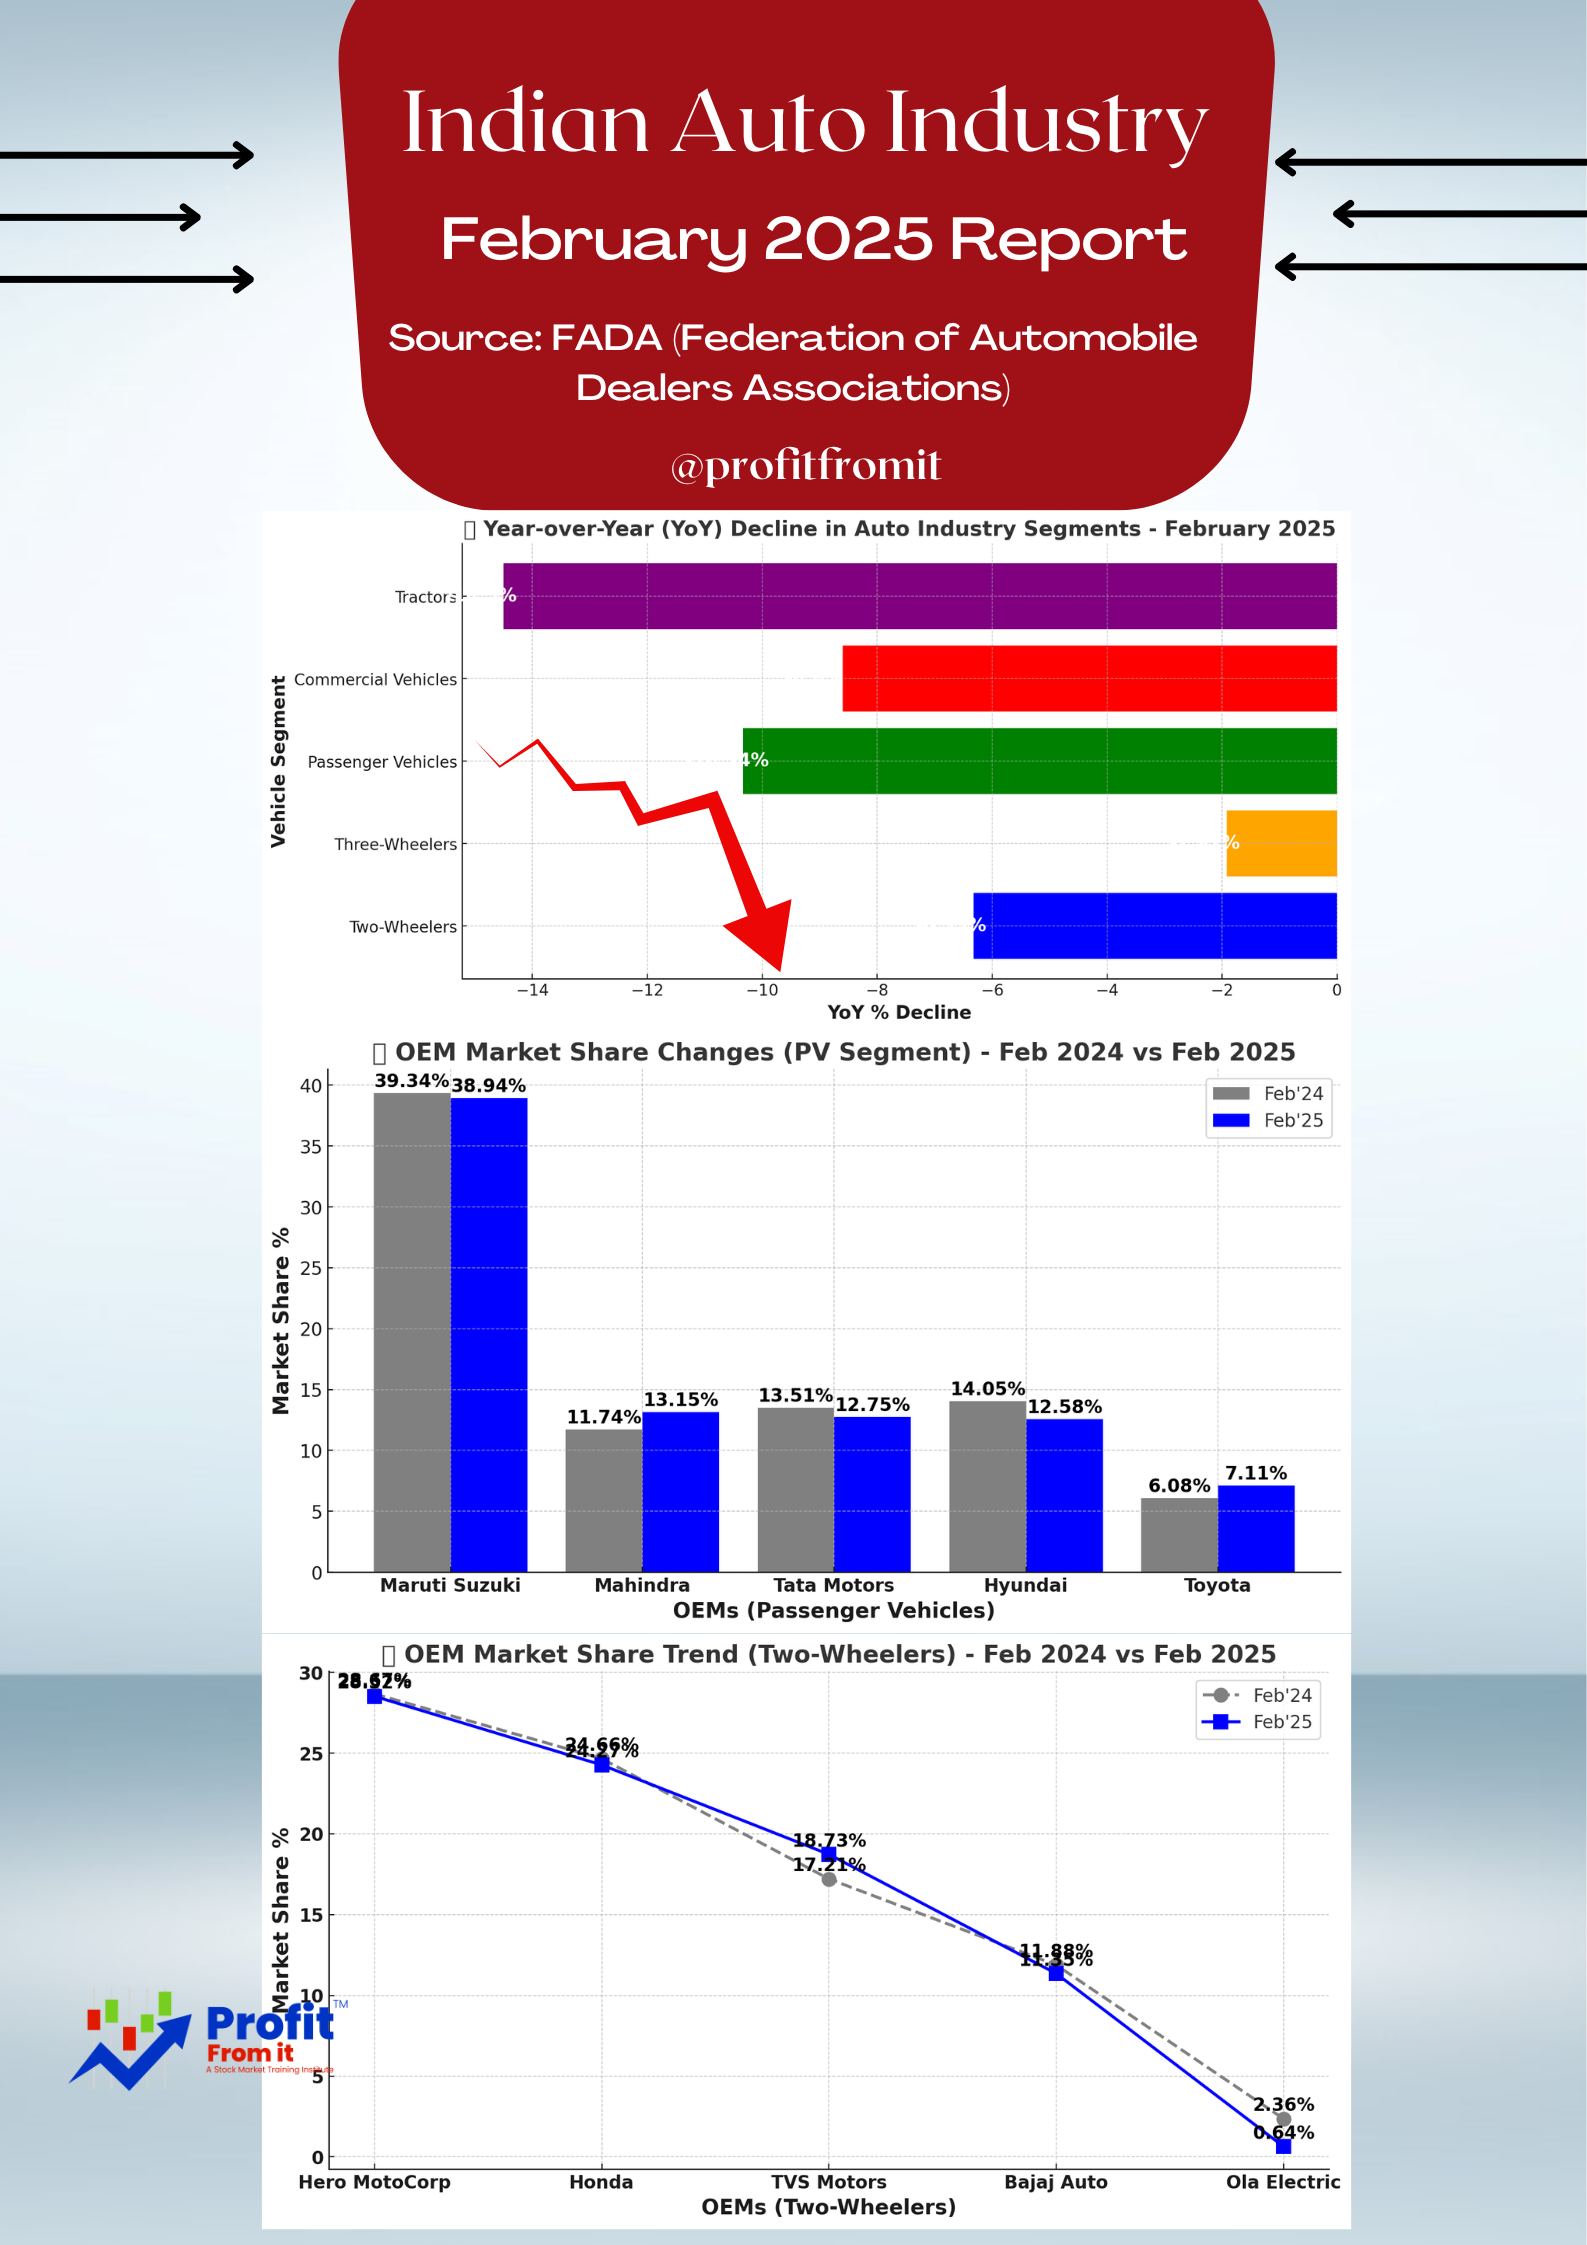
Source: FADA (Federation of Automobile Dealers Associations)
The February 2025 auto retail data reflects a broad-based downturn 📉, with all vehicle segments experiencing YoY declines. Below is a segment-wise breakdown, key trends for investors, and OEM market share changes.
🏁 1. Overall Market Performance 📉
🔻 YoY Industry Decline: -7.19% (Feb’25 vs. Feb’24)
🔻 All segments reported negative growth:
⚠️ Inventory Alert: Dealers raised concerns about OEMs pushing excess inventory, which impacts financial stability.
🔍 2. Segment-Wise Performance & Key Trends
🏍️ A. Two-Wheelers (2W)
📉 YoY Retail Decline: -6.33%
📈 YTD Growth (Apr’24-Feb’25): +8.57%
📌 Key Market Trends:
✔️ Rural markets performed better (-5.5%) vs. Urban (-7.38%) due to agricultural stability & marriage season demand
✔️ Challenges: ⚠️ Inventory imbalances, 💰 Weak consumer sentiment, 🚫 Limited financing.
🔥 Top Two-Wheeler OEMs - Market Share
🏆 📉 Hero MotoCorp: 28.52% (↓ from 28.67%)
🏆 📉 Honda (HMSI): 24.27% (↓ from 24.66%)
🏆 📈 TVS Motors: 18.73% (↑ from 17.21%)
🏆 📈 Bajaj Auto: 11.35% (↓ from 11.88%), however should remember that Bajaj Auto’s 50% turnover comes from export. Above data cover domestic sales.
⚡ 📉 Ola Electric saw a massive fall! (↓ from 2.36% to 0.64%) 🚨 Their Monthly sales last year was 34063 which fell to just 8647.
🚙 B. Passenger Vehicles (PV)
📉 YoY Retail Decline: -10.34%
📈 YTD Growth (Apr’24-Feb’25): +4.44%
📌 Key Market Trends:
✔️ Weak entry-level demand ❌, delayed purchase decisions 🛑.
✔️ Inventory levels at 50–52 days - raising financial concerns 📦.
✔️ Expected boost in March 📈 due to festivals like 🎊 Holi, Gudi Padwa, Navratri and tax depreciation benefits.
🔥 Top Passenger Vehicle OEMs - Market Share
🏆 📉 Maruti Suzuki: 38.94% (↓ from 39.34%)
🏆 📈 Mahindra: 13.15% (↑ from 11.74%) ✅ This is the WildCard entry from 4th to 2nd a big jump beating Tata Motors and Hyundai.
🏆 📉 Tata Motors: 12.75% (↓ from 13.51%)
🏆 📉 Hyundai: 12.58% (↓ from 14.05%)
🔥 📈 Toyota gained! (7.11% ↑ from 6.08%) 🚀
🚚 C. Commercial Vehicles (CV)
📉 YoY Retail Decline: -8.6%
📉 YTD Decline (Apr’24-Feb’25): -0.5%
📌 Key Market Trends:
✔️ Weak transportation sector 🚛 & finance tightening 💳 affected sales.
✔️ Tipper segment 📈 strong due to government infra spending 🏗️.
✔️ Institutional buying expected to boost March sales 📊.
🔥 Top CV OEMs - Market Share
🏆 📉 Tata Motors: 32.53% (↓ from 35.95%)
🏆 📈 Mahindra & Mahindra: 25.55% (↑ from 23.50%) ✅ Again a big jump from 3rd to 2nd Beating Ashok Leyland.
🏆 📉 Ashok Leyland: 17.39% (↓ from 17.02%)
🚖 D. Three-Wheelers (3W)
📉 YoY Retail Decline: -1.92%
📈 YTD Growth (Apr’24-Feb’25): +5.55%
📌 Key Market Trends:
✔️ Urban markets fell -3.91%, while rural remained stable 📊.
✔️ E-Rickshaw 🚖 📉 fluctuations were significant.
✔️ Finance constraints & policy changes impacted demand.
🔥 Top 3W OEMs - Market Share
🏆 📉 Bajaj Auto: 36.78% (↓ from 36.90%)
🏆 📈 Mahindra: 6.90% (↑ from 6.08%) ✅
🏆 📉 Piaggio: 7.06% (↓ from 8.61%)
🚜 E. Tractors (TRAC)
📉 YoY Retail Decline: -14.5%
📉 YTD Decline (Apr’24-Feb’25): -0.59%
📌 Key Market Trends:
✔️ Rural demand weak 📉, low liquidity 💰 & credit crunch 🏦 impacted sales.
✔️ Government subsidies & policies may support future growth 📈.
🔥 Top Tractor OEMs - Market Share
🏆 📉 Mahindra & Mahindra (23.65%)
🏆 📉 Swaraj (19.42%) (This is also subsidiary of M&M, so combined Mshare is 43.07%)
🏆 📉 John Deere & Escorts Kubota lost share.
💡 3. Key Insights for Investors 💰
✅ Bullish Signals for March 2025
🎊 Festivals (Holi, Gudi Padwa) & fiscal benefits may boost sales.
🏗️ Government infra projects may lift CV demand.
🚀 Key Market Movers
✔️ 📈 Mahindra gained market share in PV & CV.
✔️ 📈 Toyota showing strong growth.
✔️ 📈 TVS Motors performed well in 2W segment.
⚠️ Risk Factors to Watch
❌ Stock Market Impact: 5 months of falling stock indices 📉 hurt consumer sentiment.
❌ Liquidity Issues: 51.89% of dealers neutral, 28.30% bad.
❌ Inventory Pressure: OEMs pushing excess stock, impacting dealer profitability.
📌 4. Conclusion: Should Investors be Bullish or Bearish?
🔵 Short-Term: Cautiously Bullish 🚀
March 2025 looks promising due to festivals, incentives & govt spending.
🔴 Long-Term: Selective Investments
✅ Mahindra & Toyota - Strong Resilience
✅ Maruti - Strong Balance sheet and highest Mshare in PV.
✅ Bajaj Auto - Strong Balance sheet and highest Mshare in 3Wh and Exports.
⚠️ Tata & Hyundai - Losing Market Share
⚡ EVs (Ola) - Facing Challenges


.jpg)


