Listen to this Blog
Larsen & Toubro (L&T) Q4 FY25 & FY25 Financial Analysis
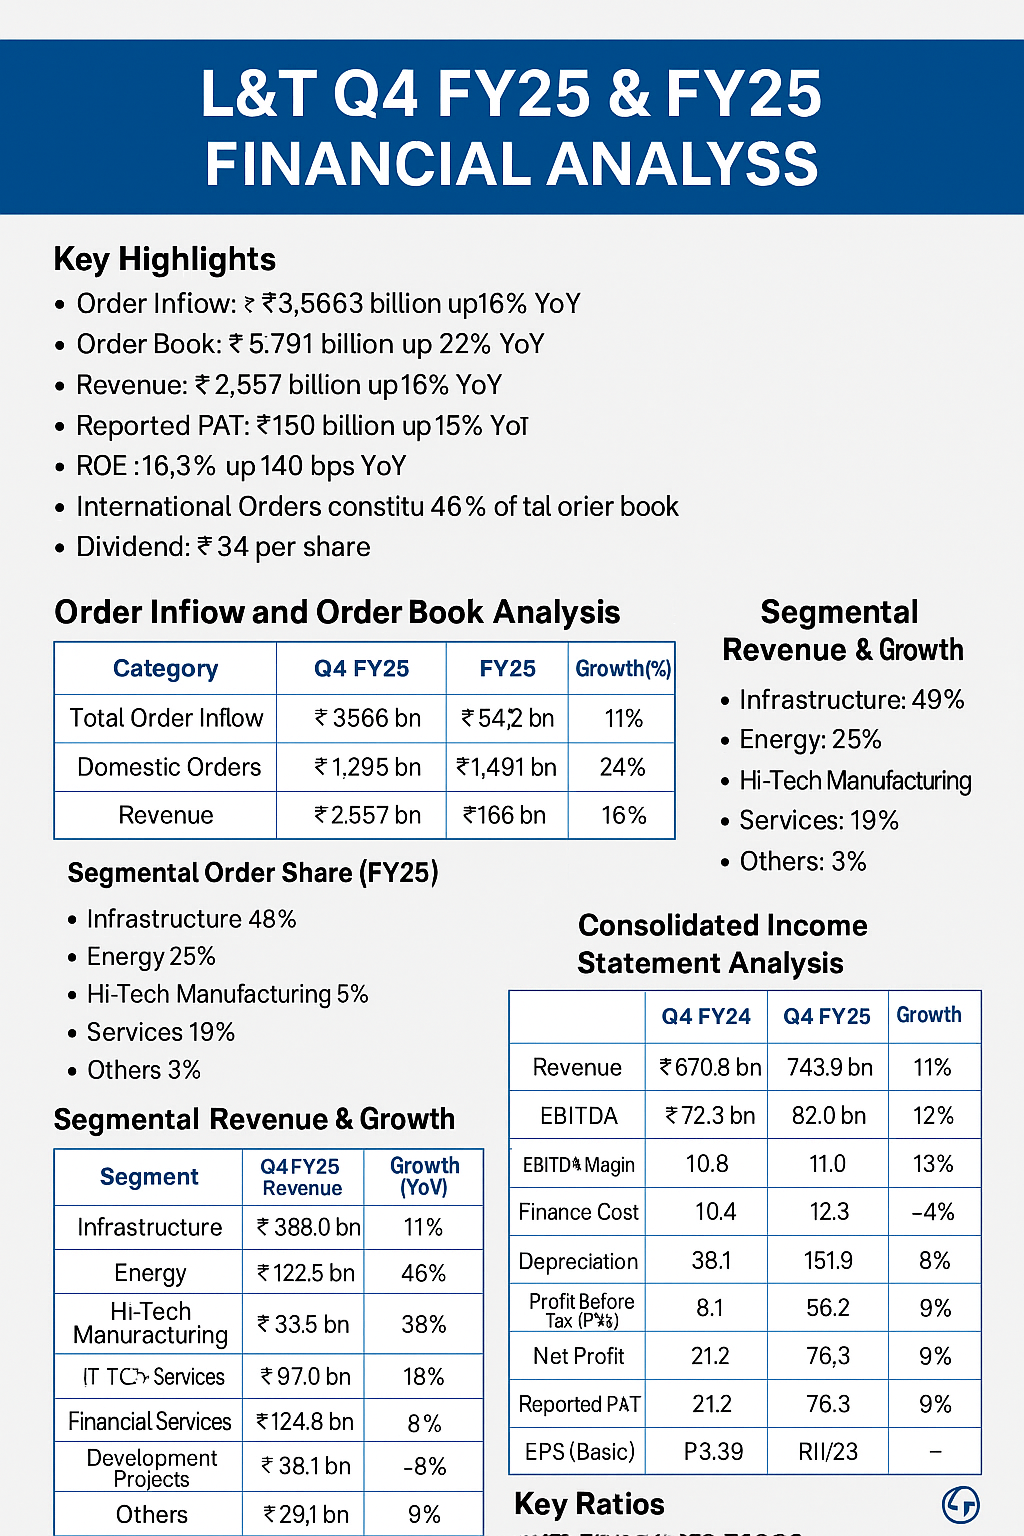
1. Key Highlights
Order Inflow: ₹3,566 billion (up 18% YoY).
Order Book: ₹5,791 billion (up 22% YoY).
Revenue: ₹2,557 billion (up 16% YoY).
Reported PAT: ₹150 billion (up 15% YoY).
ROE: 16.3% (up 140 bps YoY).
International Orders: 46% of the total order book.
Dividend: ₹34 per share.
2. Order Inflow and Order Book Analysis
Segmental Order Share (FY25)
Infrastructure: 49%
Energy: 25%
Hi-Tech Manufacturing: 5%
Services: 19%
Others: 3%
3. Segmental Revenue & Growth
4. Consolidated Income Statement Analysis
5. Balance Sheet Analysis
6. Consolidated Cash Flow Analysis
7. Key Ratios
PE Ratio (CMP: ₹3,320): 22.1x
Interest Coverage Ratio (ICR): 6.5x
ROE: 16.3% (up 140 bps YoY)
Net Working Capital (NWC) as % of Revenue: 11.0% (down from 12.0%)
8. Near-Term & Short-Term Outlook
Strong order book across diversified sectors provides revenue visibility.
Focus on timely project execution and margin stability.
Expansion in renewable energy, green hydrogen, and digital infrastructure.
Emphasis on international growth, especially in the Middle East and Europe.
Dividend policy remains shareholder-friendly with ₹34 per share.
9. Disclosure
This analysis is for educational purposes and should not be considered financial advice. Investors are advised to conduct their own research before making investment decisions.


.jpg)


