Listen to this Blog
Manyavar (Vedant Fashions Limited) Q4 FY25 Financial Analysis
Introduction
Vedant Fashions Limited, known for its popular brand 'Manyavar,' recently announced its Q4 and FY25 financial results. This blog post provides a concise overview of the company's performance, key highlights, and financial analysis for investors.
Recent Insights and Highlights
In Q4 FY25, the company expanded its retail presence by 36,000 sq. ft., and for the full fiscal year, the expansion was 85,000 sq. ft. As of March 31, 2025, the total retail presence reached 1.79 million sq. ft.
Retail sales grew by 1.9% in Q4 FY25 compared to Q4 FY24, and for the full year FY25, sales increased by 2.2% compared to FY24.
The company maintained strong margins, with a gross margin of 67.2% and a PAT margin of 28.0% in FY25.
Vedant Fashions launched 'Diwas,' a D2C brand focused on festive and celebration wear, which has received a positive consumer response.
The company also launched the 'VFL Parivaar' app, an AI-driven learning management platform for frontline fashion advisors.
FY25 performance was impacted by subdued consumer sentiment and a challenging Q1 due to fewer wedding dates. However, retail sales grew by 9.3% in the nine months from July to March FY25, with like-to-like sales growth of 2.9%.
🏬 Retail Footprint & Store Growth
Segment Analysis
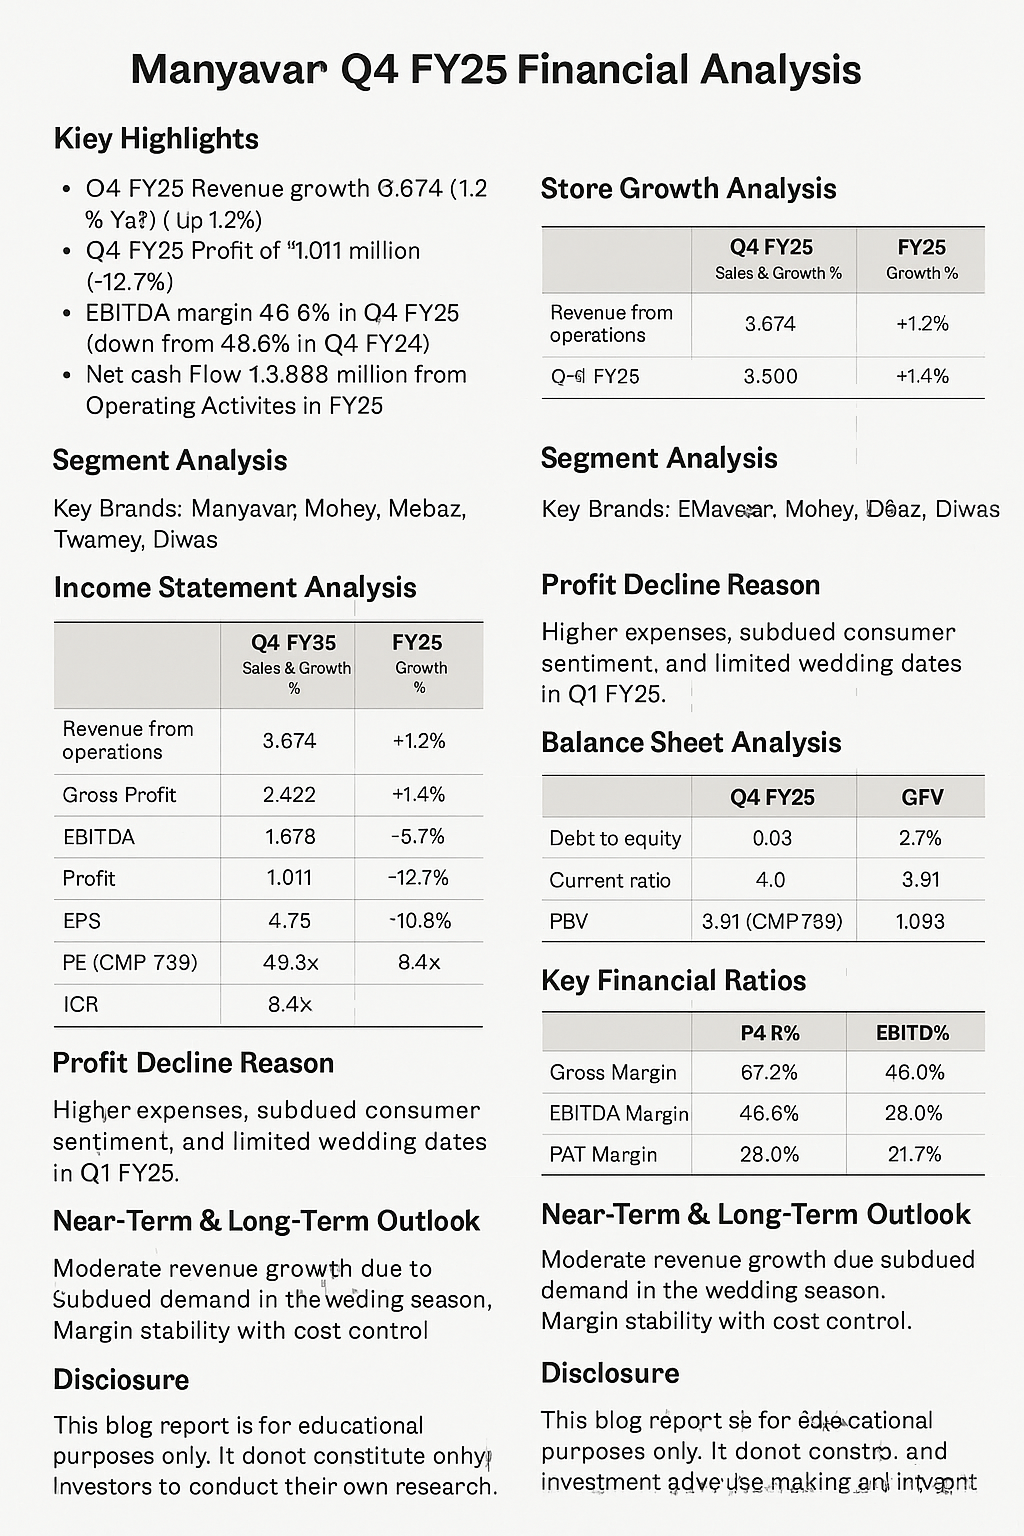
Key Brands: Manyavar (Men’s Ethnic Wear), Mohey (Women’s Celebration Wear), Mebaz (South India Focused), Twamev (Premium Men’s Wear), Diwas (D2C Celebration Wear).
Retail Channels: EBOs, Online, MBOs, LFS.
Income Statement Analysis (INR Million)
Profit Decline Reason: Higher expenses, subdued consumer sentiment, and limited wedding dates in Q1 FY25.Margin Pressure: Decline in EBITDA margin due to slightly higher operating costs.
Balance Sheet Analysis (INR Million)
Strong Equity Growth: Driven by consistent profitability.Conservative Leverage: Low debt and strong liquidity.
Cash Flow Statement Analysis (INR Million)
Decline in Cash from Operations: Due to working capital adjustments.Reduced Cash Outflow in Investing: Reduced CAPEX investments.
Key Financial Ratios
PE Ratio (CMP ₹739): 43.3x
ICR (Interest Coverage Ratio): 9.4x
Gross Margin: 67.2%
EBITDA Margin: 46.6%
PAT Margin: 28.0%
ROE (Return on Equity): 21.7%
🔍 Near & Short-Term Outlook
Q1 FY26: Weak start due to negligible wedding dates, but demand expected to rebound in H2.
Growth Focus: Aggressive store expansion in Tier 2/3 cities, scaling up Diwas and Mohey.
Margins: Industry-leading, but raw material cost inflation is a watch point.
Digital: Positive response to new AI-driven retail advisor app.
Disclosure
This blog report is for educational purposes only. It does not constitute any investment advice. Investors are advised to conduct their own research before making any investment decisions.


.jpg)


