Listen to this Blog
🔬 PI Industries Ltd – Q4 & FY25 Results Review | Growth, Margins, and Outlook
📅 Report Period: Q4 FY25 & FY25
📈 CMP: ₹3,688
🏢 Industry: Agrochemicals & Life Sciences
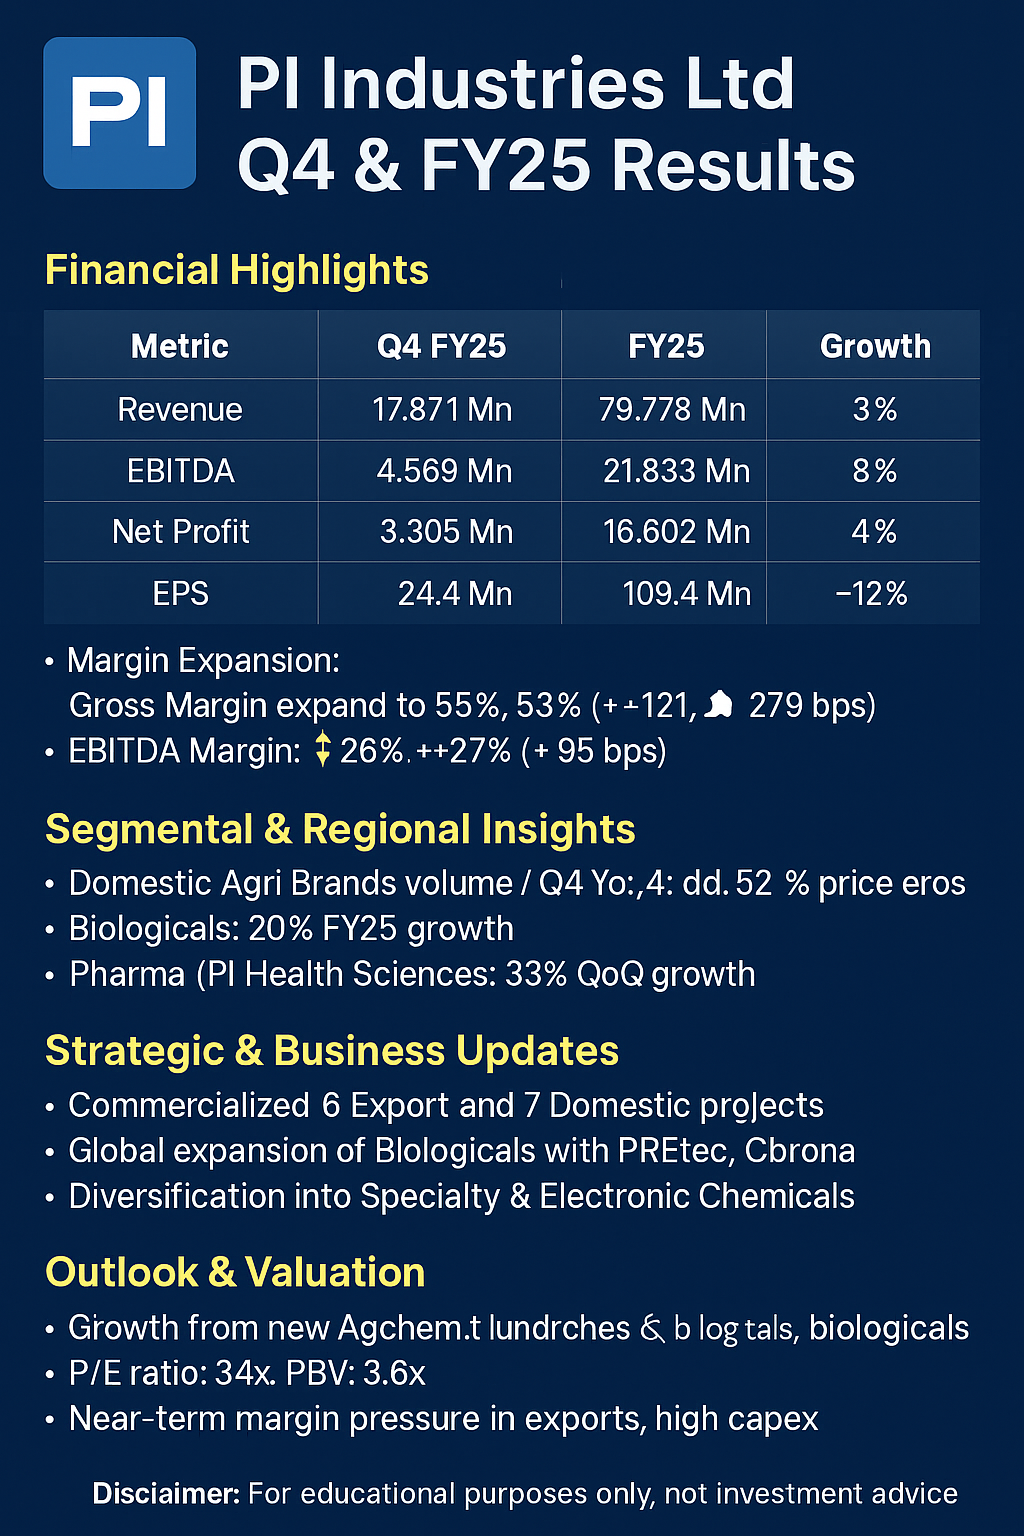
📊 Financial Highlights
Consolidated Income Statement Summary:
🚀 Segmental & Regional Insights
Domestic Agri Brands:
Q4: +21% YoY (Volume +24%)
FY25: +6% YoY (Volume +9%)
Strong growth due to good Rabi season and new launches
Agchem Exports:
Q4: -5% (Volume +7%)
FY25: +5% YoY (New product contribution +31%)
Price erosion due to softening input costs
Biologicals:
Q4: +10% YoY
FY25: +20% YoY
Strong traction with sustainable agri solutions
Pharma (PI Health Sciences):
Q4: 6% of exports revenue
33% QoQ growth
📈 Key Financial Ratios (Consolidated)
💰 Cash Flow Snapshot
📉 FCF decline driven by higher capex for new capacity and R&D expansion.
🧪 Strategic & Business Updates
6 new products commercialized in Exports, 7 in Domestic Agri
Biologicals: Global expansion plan with PREtec, Obrona, Saori, and Teikko in portfolio
Diversification into Specialty & Electronic Chemicals
Strong engagement via 15,000+ distributors and 1.6 Mn farmers
🔭 Outlook & Valuation
Valuation Ratios (CMP ₹3,688):
PE Ratio: ~33.7x
PBV: ~3.6x
Near-term growth supported by:
Continued biologicals expansion
New launches in Agchem and Pharma
Strengthened India distribution
Challenges: Margin pressure in exports, high capex impacting cash
📌 Investor View
🔷 Long-term outlook remains promising, supported by diversified growth engines
🔷 Near-term volatility in profitability due to high tax and input price dynamics
🔷 Investors may accumulate on dips with a 5-year horizon
⚠️ Disclaimer
This analysis is for educational purposes only and should not be construed as investment advice. Investors are advised to do their own due diligence before making any investment decisions.


.jpg)


