
Listen to this Blog
🔋 India Energy Sector Outlook (FY 2025–2035): Where the Next Decade is Headed
India is in the midst of an energy revolution. With an ambitious vision of achieving net-zero emissions by 2070, the country is rapidly transitioning to renewables while modernizing its infrastructure. If you're an investor eyeing India’s energy sector, this blog is your roadmap to future-proof opportunities through 2035.
🔍 Key Current Highlights (FY 2023–24)
📊 Energy Supply & Consumption
Total Primary Energy Supply (TPES) grew by 7.8%, reaching 9,03,158 KToE.
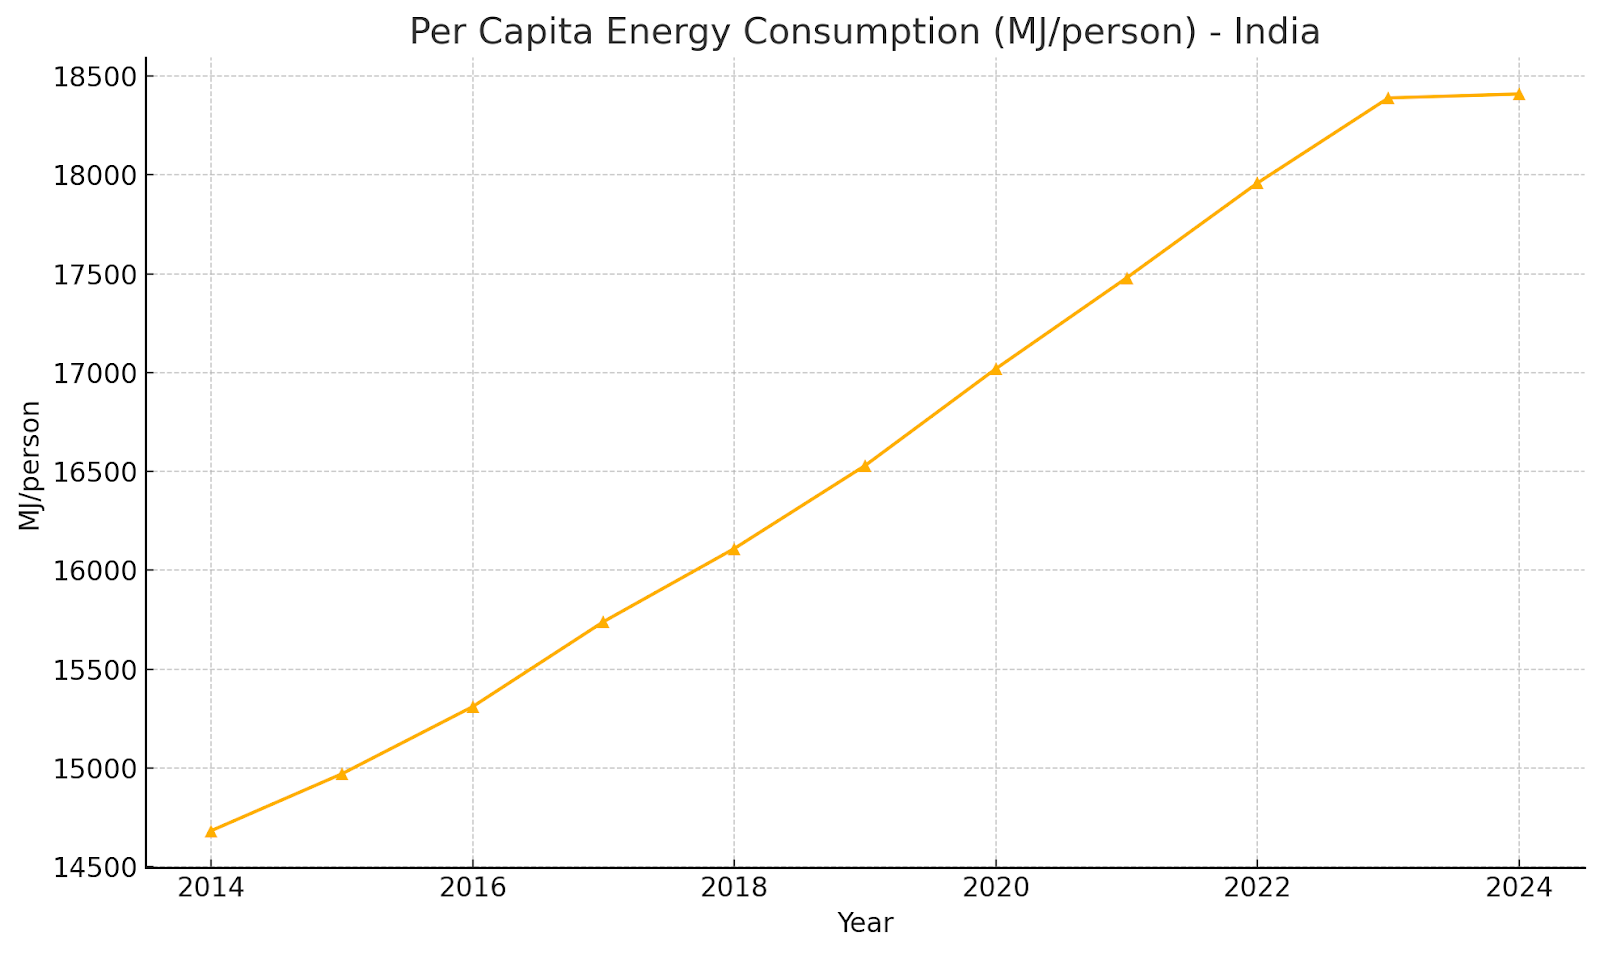
Per capita energy consumption increased to 18,410 MJ/person, with a CAGR of 2.55% over the past decade.
⚡ Electricity Generation
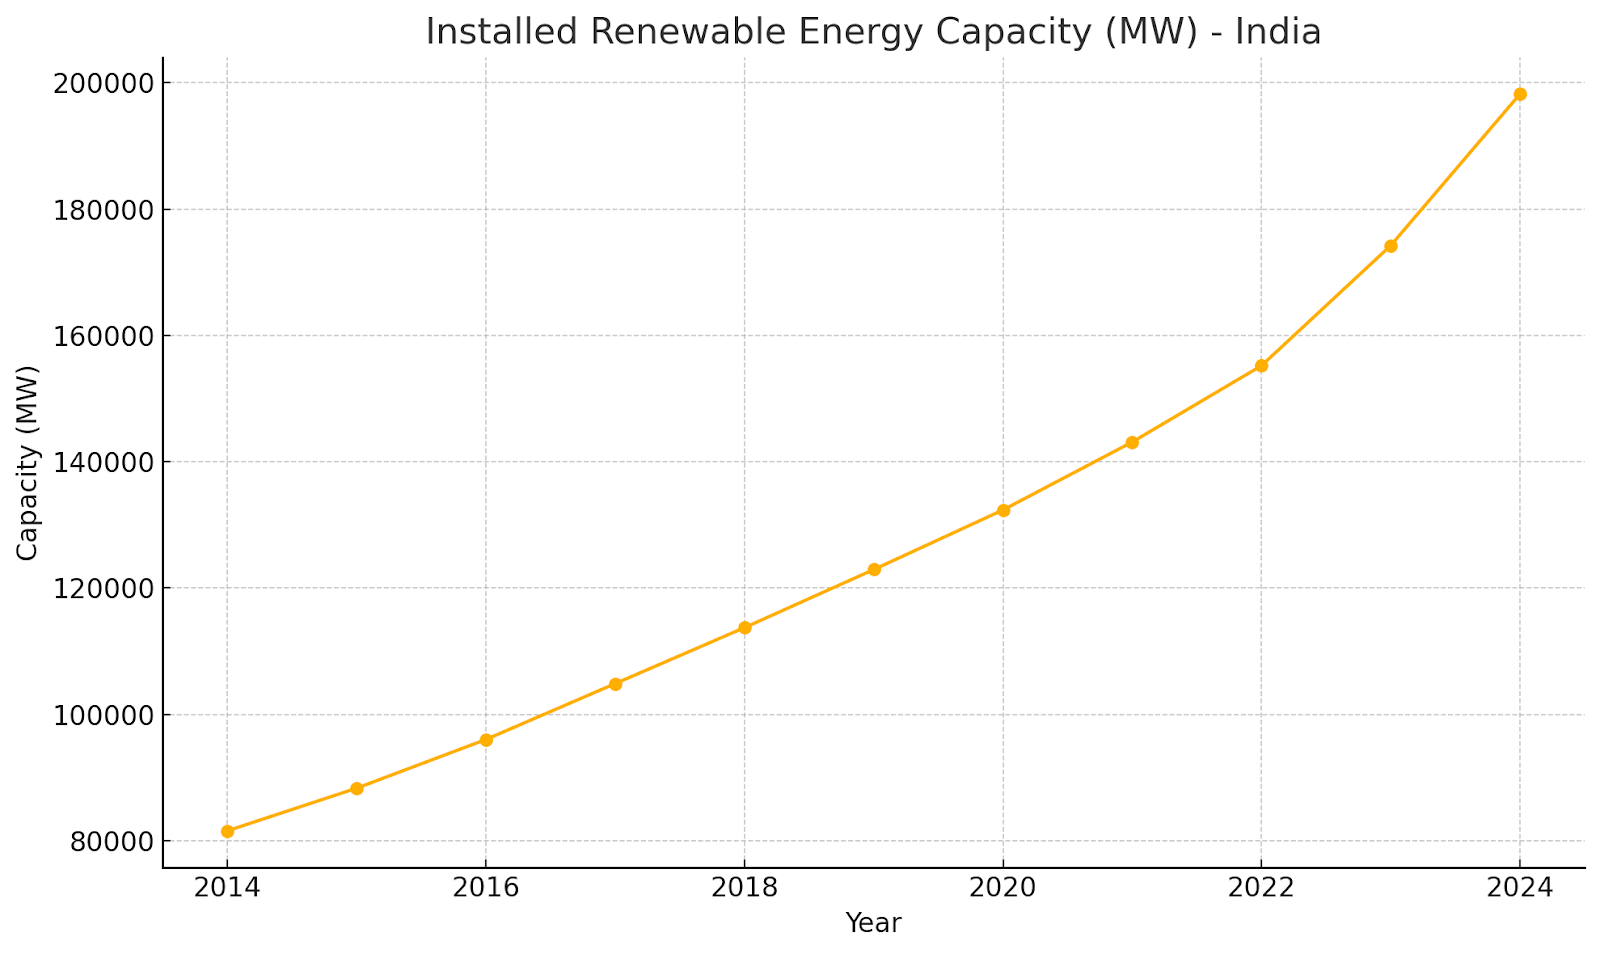
Renewable energy installed capacity grew from 81,593 MW in FY15 to 1,98,213 MW in FY24 — a CAGR of 10.36%.
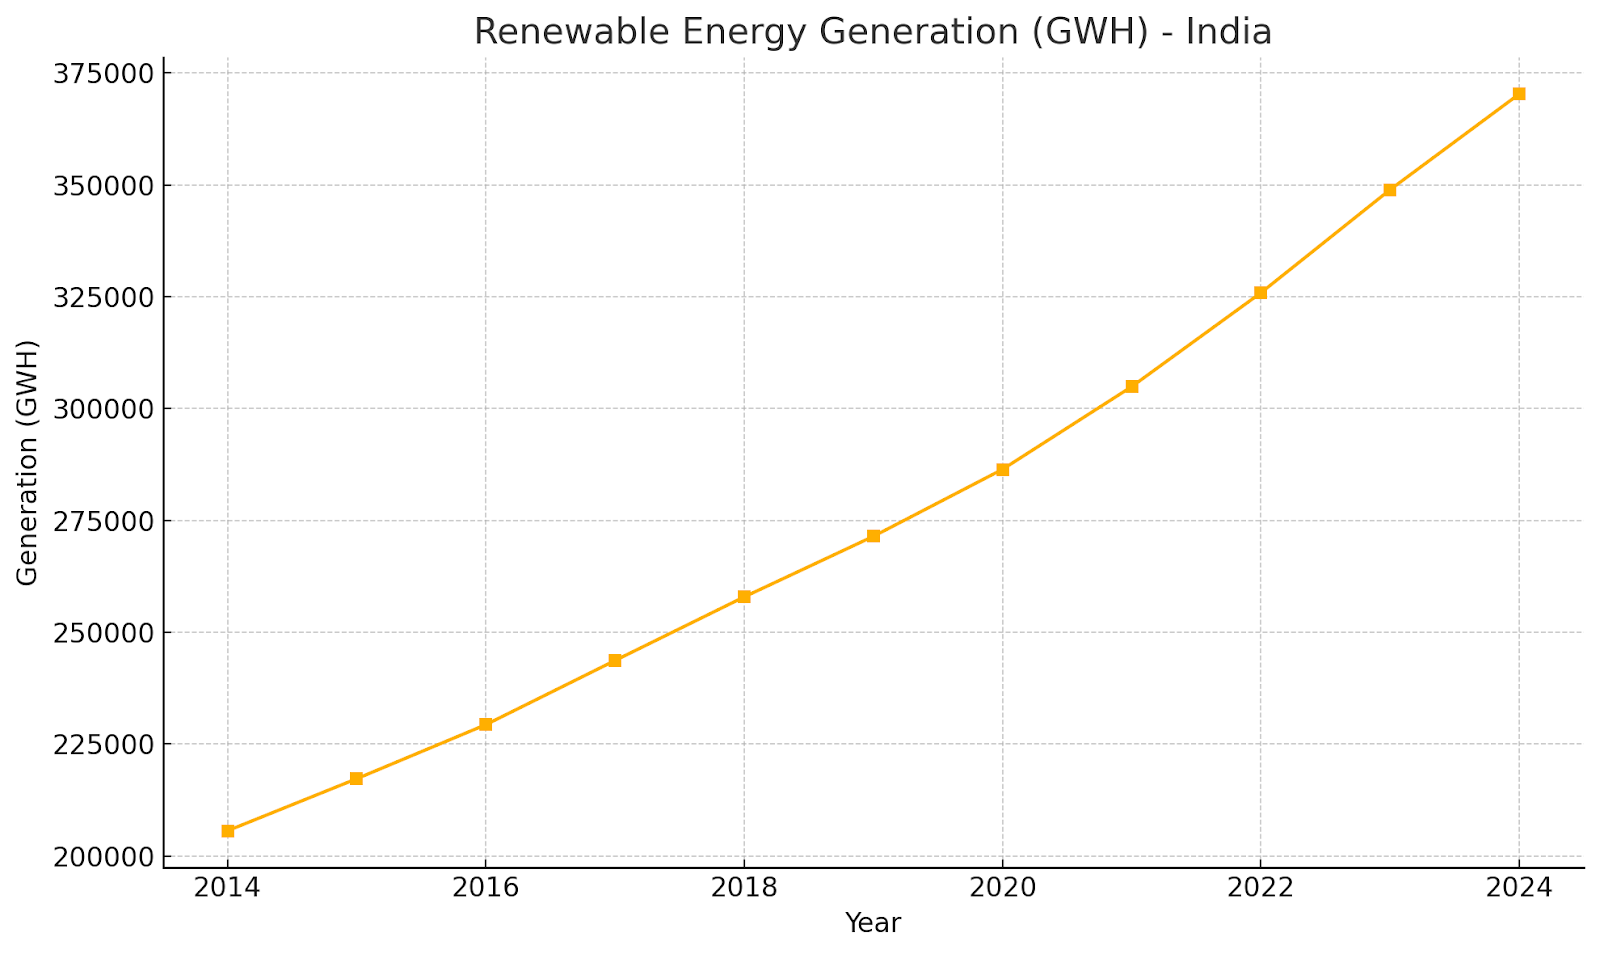
Renewable electricity generation rose from 2,05,608 GWH in FY15 to 3,70,320 GWH in FY24 — CAGR: 6.76%.
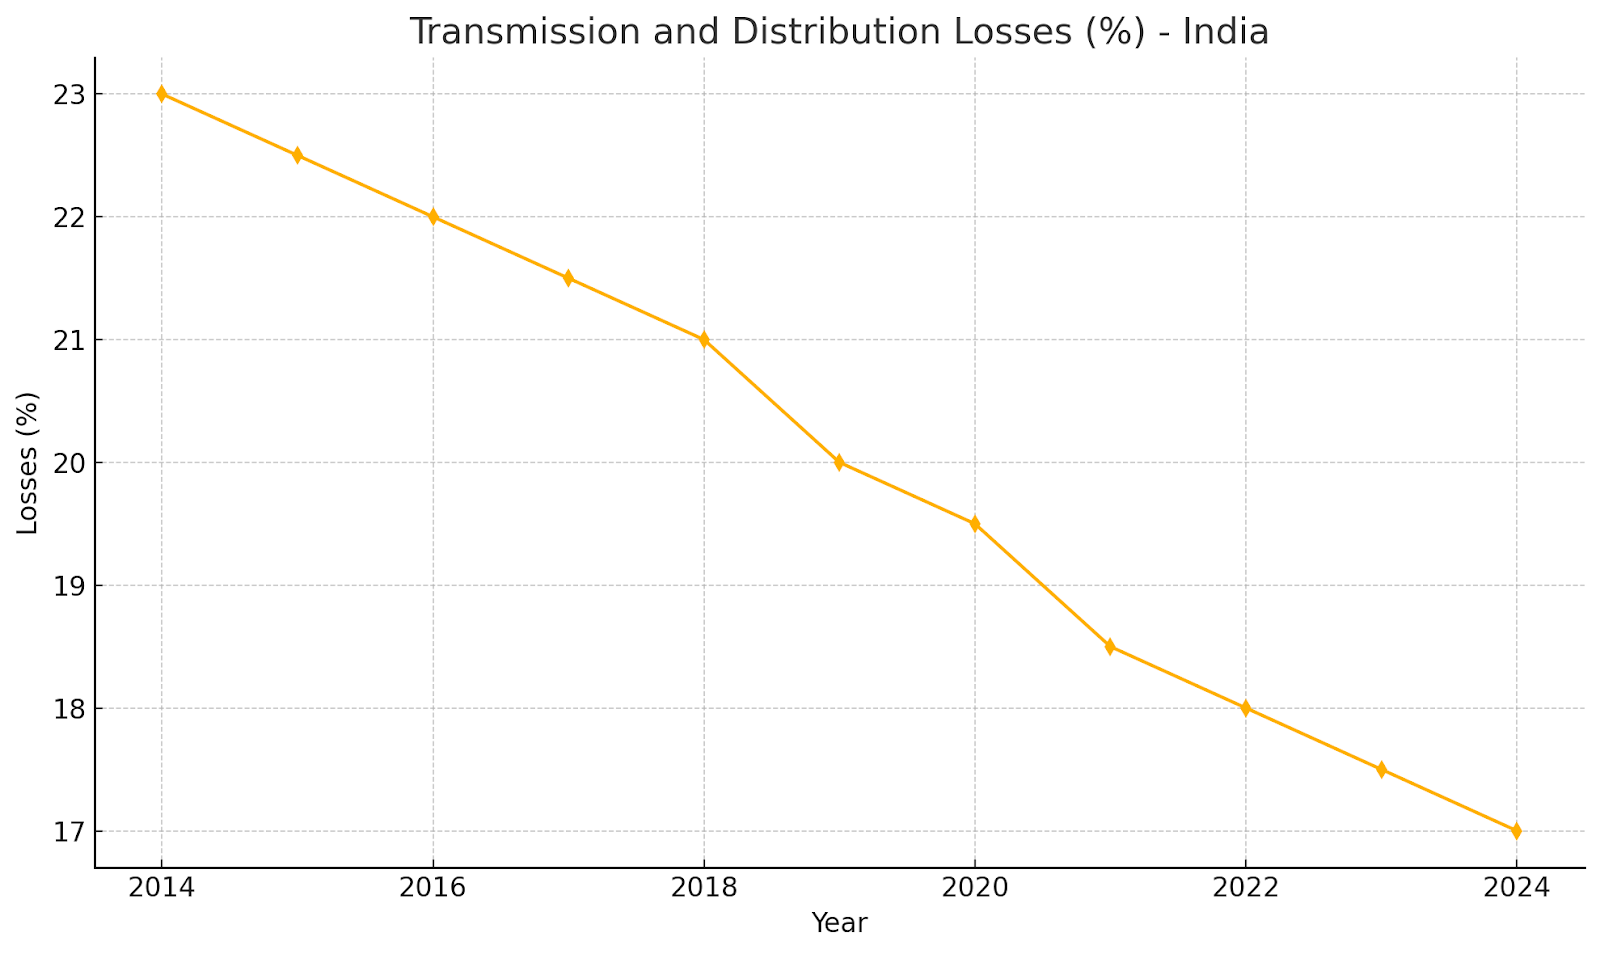
T&D losses improved significantly: down from 23% to 17% in the last decade.
🏭 Sector-wise Energy Use
Industry remains the dominant energy-consuming sector:
Consumption grew from 2,42,418 KToE (FY15) to 3,11,822 KToE (FY24).
🔮 Projections and Trends to FY 2035
🌞 Top Growth Segment: Renewables
India's renewable energy potential is pegged at ~2,109 GW, with:
Wind: 55% (~1,163 GW)
Solar: 35% (~749 GW)
Hydro & Others: ~197 GW
Projection for FY 2035:
Installed renewable capacity could exceed 500 GW, supported by:
Government targets (Net Zero by 2070, 500 GW non-fossil by 2030)
State-level implementation (Rajasthan, Maharashtra, Gujarat, Karnataka lead)
📈 Growth KPIs by Segment
🌍 Sector Growth Snapshot
India's energy ecosystem has seen phenomenal growth across multiple metrics:
📈 Visual Insights
1. Installed Renewable Energy Capacity (MW)
2. Renewable Energy Generation (GWH)
3. Per Capita Energy Consumption (MJ/person)
4. Transmission & Distribution Losses (%)
🚀 Sub-Sectors Poised for Growth
📊 Company KPI Comparison (FY24)
📌 Key Insight:
🔍 Waaree Energies stands out with a Debt-to-Equity ratio of just 0.2, signaling robust solvency — a major strength for a capital-intensive business.
🔍 IREDA's D/E is higher because it's a lending institution (NBFC), which is normal and healthy in that context.
🔍 Companies like Suzlon and Reliance have notably improved solvency.
🔍 Company like Powergrid Stable regulated returns.
🔍 Hydro Power Company like NHPC Cash-rich PSU with balanced leverage, but miss the sales growth.
🔍 Diversified Company like Reliance with balanced debt & consistent in Profits.
📊 Suggested FY 2035 Goals for Investors
💡 Investor Takeaways
Top Opportunities: Solar, Green Hydrogen, EV Infra, Renewable Finance
Top KPIs to Watch: Revenue CAGR, ROE, Net Profit Margin, D/E Ratio
Strategy Tip: Diversify across manufacturing, power generation, and finance
Policy Tailwinds: Net Zero 2070 target, 500 GW non-fossil by 2030, PLI schemes
📌 Final Word
India’s energy transformation is a multi-decade megatrend. As capital flows toward clean and scalable solutions, early-stage investments in leading and emerging players can generate long-term alpha.


.jpg)


