Listen to this Blog
Q3 FY25 Supreme Industries Ltd. 📊
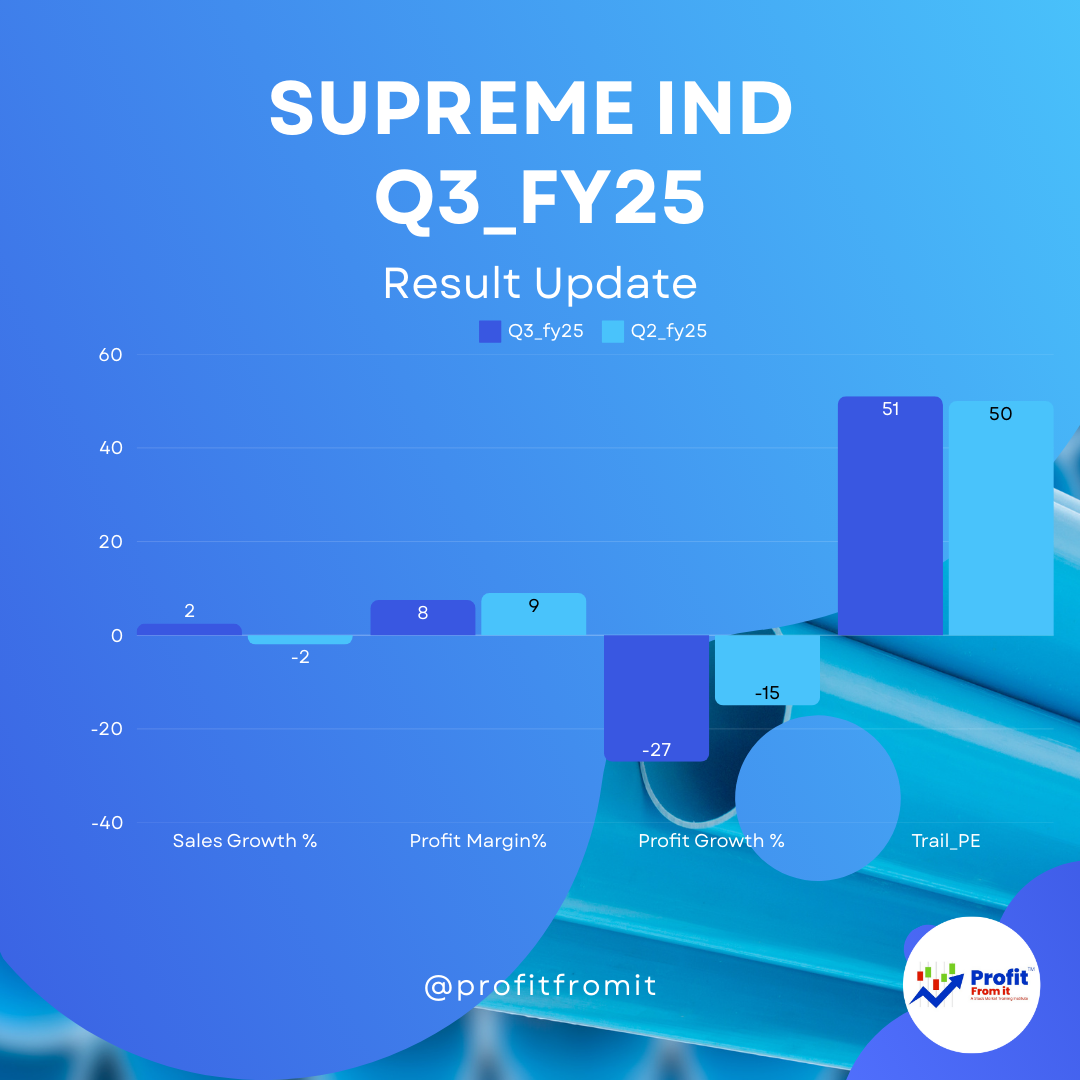
1. Financial Performance Overview:
Revenue Growth: 💹 Revenue from operations increased from ₹2,449.10 crores in Q3 FY24 to ₹2,509.88 crores in Q3 FY25, marking a 2.48% year-over-year increase. The total income rose slightly by 1.98% from ₹2,469.81 crores in Q3 FY24 to ₹2,518.78 crores in Q3 FY25.
Profitability: 💸 Profit after tax (PAT) decreased by 26.99% year-over-year from ₹256.17 crores in Q3 FY24 to ₹186.97 crores in Q3 FY25. This decline is reflected in a lower profit margin for the quarter.
Earnings per Share (EPS): 📉 There was a decrease in EPS from ₹20.17 in Q3 FY24 to ₹14.72 in Q3 FY25.
2. Volume and Sales Growth:
The company reported a 3% volume growth 📈 and a 2% value growth in plastic goods during the quarter, showing modest growth in its core business activities.
3. Segmental Performance:
Plastics Piping Products: 🚰 Revenue increased from ₹1,643.65 crores in Q3 FY24 to ₹1,664.93 crores in Q3 FY25.
Industrial Products: 🏭 Slight increase from ₹331.95 crores in Q3 FY24 to ₹332.36 crores in Q3 FY25.
Packaging Products and Consumer Products: 📦 Also showed growth, indicating resilience across diversified product lines.
4. Expense Analysis:
Cost of Materials Consumed: 📈 Increased significantly from ₹1,705.22 crores in Q3 FY24 to ₹1,826.92 crores in Q3 FY25, impacting the overall profit margins.
5. Key Performance Indicators (KPIs) for Investors:
Profit Margin: 💰 The net profit margin decreased, as noted from the profit after tax figures.
Valuation Ratios: 💸 At a current market price (CMP) of ₹4,038, and considering the Trail EPS of ₹80.4, the Trail Price to Earnings (Trail P/E) ratio is approximately 50.7, which is high.
6. Near Term and Long Term Outlook:
Near Term: 🕒 The near-term outlook might be cautious due to decreased profitability in the current quarter and increasing costs. Investors might look for management commentary on cost control and market expansion strategies.
Long Term: 🚀 The company’s ability to maintain a diverse product range and slight growth in volumes suggests resilience. Long-term growth will depend on continued innovation and market expansion, especially in emerging market segments.
Investor Perspective:
Investors should monitor the company’s expense management and segmental growth closely, especially the plastics piping segment which is a significant revenue contributor. The valuation at current levels suggests high expectations while growth is lower, which requires sustained performance improvements to justify.
This analysis provides a snapshot of Supreme Industries' performance with implications for both short-term and long-term investment perspectives, taking into account current market conditions and internal financial metrics.


.jpg)


