Listen to this Blog
Report on Indian Banking Sector at a Glance:
1. Balance Sheet Operations 📊
Total Liabilities/Assets saw a significant growth from ₹2,43,18,429 crore in 2023 to ₹2,80,80,550 crore in 2024, showing a 15.5% increase. 💹
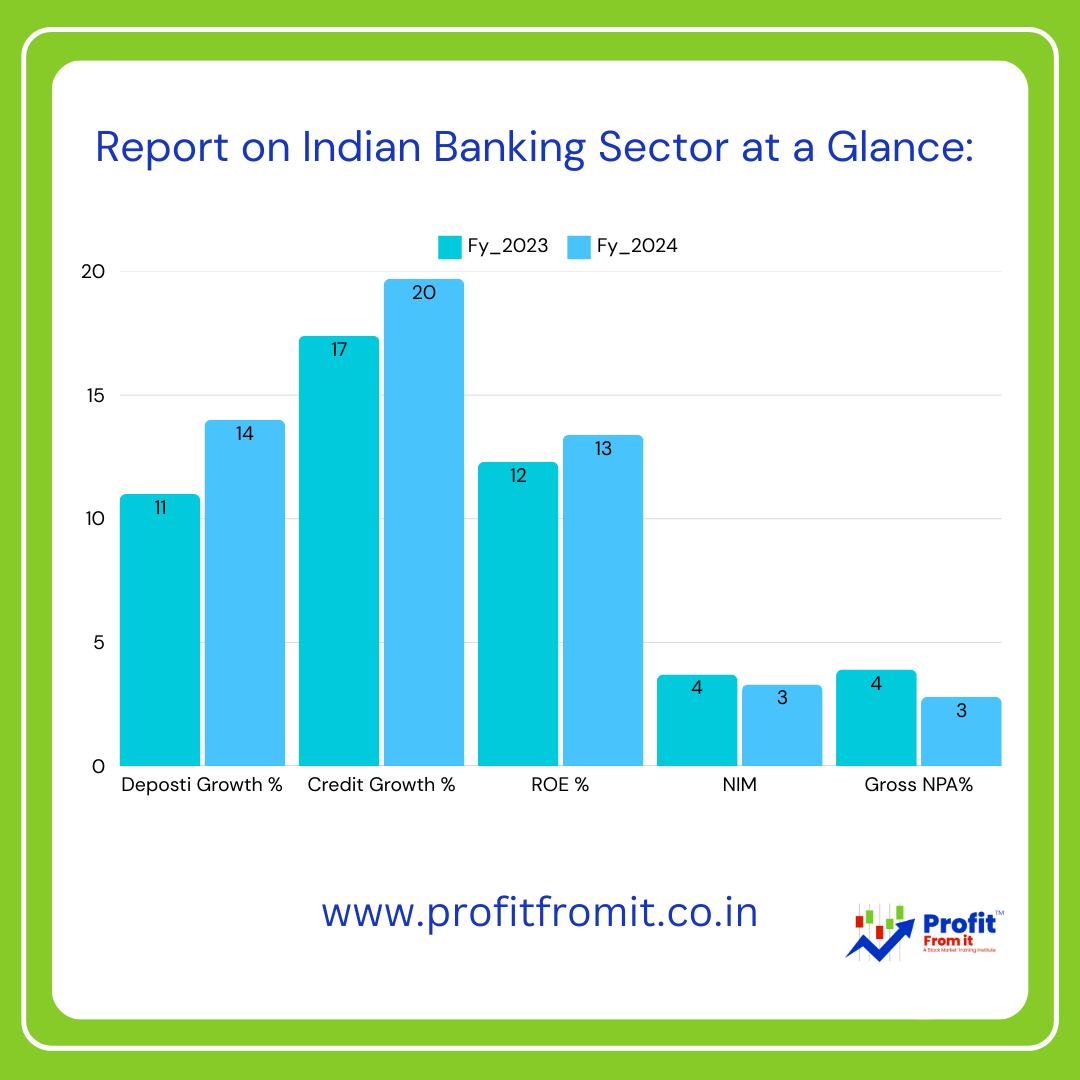
Deposits grew by 14.0%, indicating robust savings or trust in banking operations. Reached 217.33 Lakh Cr from 190.7 Lakh Cr 🏦
Loans and Advances increased by 19.7%, which reflects a higher credit dispensation by banks. Advances reached 171.4 Lakh Cr from 143.2 lakh Cr previous Year💸
2. Profitability 💰
Net Profit increased from ₹2,63,214 crore to ₹3,49,603 crore, showing strong profitability in the sector. 📈
Return on Assets (RoA) remained stable at 1.2%, while Return on Equity (RoE) increased from 12.3% to 13.4%, suggesting better utilization of equity. ⚖️
Net Interest Margin (NIM) saw a decrease from 3.7% to 3.3%, which might reflect lower interest returns on assets relative to the interest paid on liabilities. 🔽 This was due to high interest rates last year.
3. Asset Quality 🛡️
Gross NPAs dropped significantly from ₹5,71,546 crore to ₹4,80,818 crore, showing a -15.9% change, indicating improved asset quality. 📉 GNPA % ratio reached to 2.8 from 3.9 Previous Year.
Net NPA Ratio improved from 0.9% to 0.6%, suggesting effective management of non-performing assets. ✔️
4. Sectoral Deployment of Bank Credit 🌾🏭🏪
Growth was notable in Personal Loans (27.5%) and Services (23.5%), indicating consumer confidence and a growing service sector. 📊
Agriculture and Industry sectors also saw healthy credit growth of 20.0% and 8.5%, respectively. 🚜🏗️
5. Technological Development 🖥️
Credit Cards and Debit Cards issuance grew, showing an increase in digital payment adoption. 💳. Total Credit card holders reached 10.2 Cr from 8.5 Cr Previous year.
A slight decrease in the number of ATMs indicates a potential shift towards more digital transactions or operational optimizations. 🏧 UPI growth is substantial and has decreased the footfall in ATM’s. Hence no ATM's remained flat to 2.5 Lakh.
6. Customer Services 🗣️
An increase in customer complaints might reflect growing pains with the expansion of services or adjustments in customer service quality. 📞
7. Financial Inclusion 🌍
The Credit-Deposit Ratio increased from 75.1% to 78.9%, showing a higher proportion of credit given out against deposits, which can be a sign of an aggressive credit strategy or growing demand for loans. 💹
Future Investment Outlook 🚀
Given the trends:
Increased profitability and improvement in asset quality suggest that the banking sector could remain a solid area for investment. 💰
Growth in personal loans and sector-specific credit deployment might indicate areas where banks are expecting higher returns. 📊
Monitoring future policies, digital banking adoption, and global economic conditions will be crucial to understand the ongoing trends and investment opportunities in the Indian banking sector. 🌐


.jpg)


