🏦 SBI Q4 & FY25 Result Update: Strong Profit Growth Amidst Stable Asset Quality
📌 Key Highlights
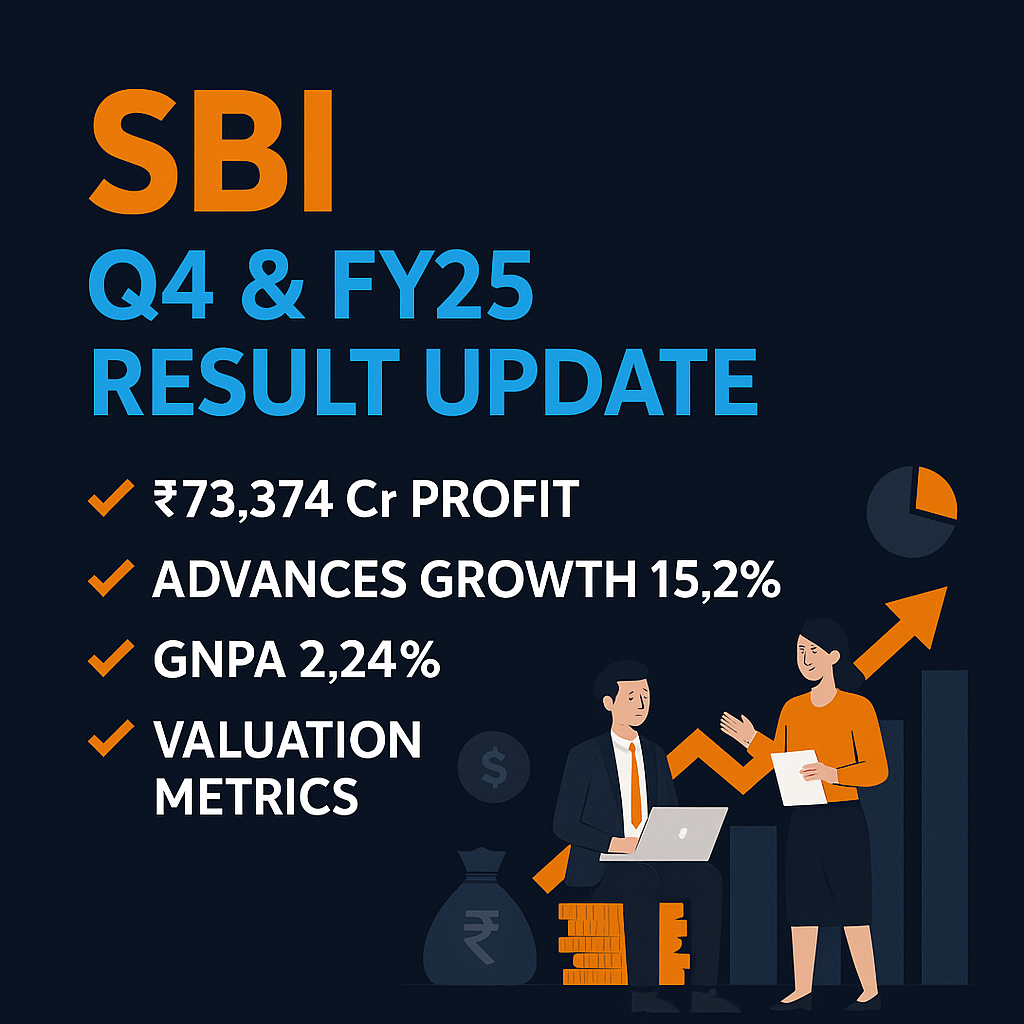
✅ Consolidated Net Profit for Q4FY25 surged to ₹21,384 Cr, up 24.4% YoY.
✅ FY25 Consolidated Profit stood at ₹73,374 Cr, up 20.6% YoY, a record high.
✅ Gross Advances rose 15.2% YoY to ₹37.67 lakh Cr.
✅ GNPA ratio improved to 2.24% in Q4FY25 vs 2.42% in Q3FY25 and 2.78% in Q4FY24.
✅ Strong growth in Retail Loans (18.7%) and Corporate Loans (16.7%) YoY.
✅ Net Interest Income (NII) for FY25 rose to ₹1,55,987 Cr from ₹1,38,443 Cr in FY24.
✅ Board declared dividend of ₹13.70 per share.
📈 SBI remains the largest lender in India with a growing digital footprint and robust CASA base.
🔢 Segmental Performance – FY25

| Segment | Contribution (₹ Cr) | Growth YoY | Share in Total |
|---|---|---|---|
| Retail Loans | ₹14.39 lakh Cr | +18.7% | ~38% |
| Corporate Loans | ₹10.85 lakh Cr | +16.7% | ~29% |
| Agri Loans | ₹3.48 lakh Cr | +16.3% | ~9% |
| SME Loans | ₹4.51 lakh Cr | +20.3% | ~12% |
| International | ₹5.20 lakh Cr | +10.7% | ~12% |
📊 Financial Performance
🔹 Advances Growth
Q4FY25 Advances: ₹37.67 lakh Cr vs ₹32.70 lakh Cr in Q4FY24 – up 15.2% YoY.
FY25 Overall Advances grew across retail, SME, and corporate segments, supported by strong credit demand and stable interest rate environment.
🔹 Consolidated Revenue Growth
Q4FY25 Revenue: ₹1,38,916 Cr vs ₹1,06,887 Cr in Q4FY24 – up 30% YoY.
FY25 Total Income: ₹4,69,982 Cr vs ₹3,99,629 Cr – up 17.6% YoY .
🔹 Consolidated Profit Growth

| Period | Consolidated PAT (₹ Cr) | YoY Growth |
|---|---|---|
| Q4FY25 | ₹21,384 Cr | +24.4% |
| FY25 | ₹73,374 Cr | +20.6% |
🛡️ Asset Quality
| Metric | Q4FY25 | Q3FY25 | Q4FY24 |
|---|---|---|---|
| GNPA % | 2.24% | 2.42% | 2.78% |
| NNPA % | 0.57% | 0.64% | 0.67% |
Consistent improvement in asset quality supported by prudent underwriting and robust provisioning.
🧮 Key Ratios (FY25)
🔸 Solvency, Liquidity & Profitability
| Ratio | Value | Remarks |
|---|---|---|
| Capital Adequacy | 14.28% | Well above regulatory norms |
| Net Interest Margin | 3.29% | Stable NIM |
| ROA (Return on Assets) | 1.11% | Improved profitability |
| ROE (Return on Equity) | 20.21% | Significantly robust |
| CASA Ratio | 41.11% | Reflects low-cost deposit base |
🔸 Valuation Metrics (CMP ₹800)
🧭 Outlook
📈 Near-Term Outlook
Stable interest rate regime, strong loan demand, and consistent CASA growth to support NIMs.
Continued digital transformation and focus on retail/SME lending may sustain growth momentum.
🌐 Long-Term Outlook
SBI is well-positioned to benefit from India’s rising credit cycle, growing formalization of the economy, and financial inclusion.
Asset quality trajectory and operational efficiency to drive long-term ROE expansion and market re-rating potential.
🔍 Disclosure


 for Investors The provided chart outlines key metrics for Nifty 500 companies across different periods (FY22 t.png)


