Josh June Monthly Nifty Indices View 2026
Coverage:
What we discussed Marvelous May
What happened in Marvelous May
What to expect in Josh June
Nifty Pivot Points.
+ve broader indices for the coming months.
-ve broader indices for the Coming Months:
Fundamentals
Nifty Intrinsic Value as per current earnings
Schedule Of Meetings
Indices View Nifty

What We Discussed in Marvelous May Nifty is 23998
Despite a good recovery last month, Considering the lower High lower low for 3 months in a row, the important level to track this whole month should be previous month high 24602, as making high in current situation is abnormal v/s making low is normal. Nifty’s failure to move beyond or staying below 24602 can give further direction. Nifty’s strength to move beyond 24602 will cut the lower low trend making the higher high boosting the recovery further for the 2nd month in a row. Yes, Nifty’s ability to move beyond 24602 can help Nifty recover for the 2nd month in a row towards 25006 which would be the higher high, 26013 or even 27425 which could be the new lifetime high. Nifty on the other hand if it fails to move beyond 24602 can drag the fall further towards 22587. The strongest support even in this case should be the “a” fall low 21744 which is now even the 50 MEMa which we have not seen post Covide_fall. Hence the level to track closely for this month should be previous month high 24602 for the decisive move ahead. Anyway, stick to the rules: Continue SIP till market is in correction. Buy during falls and avoid buying during rally.
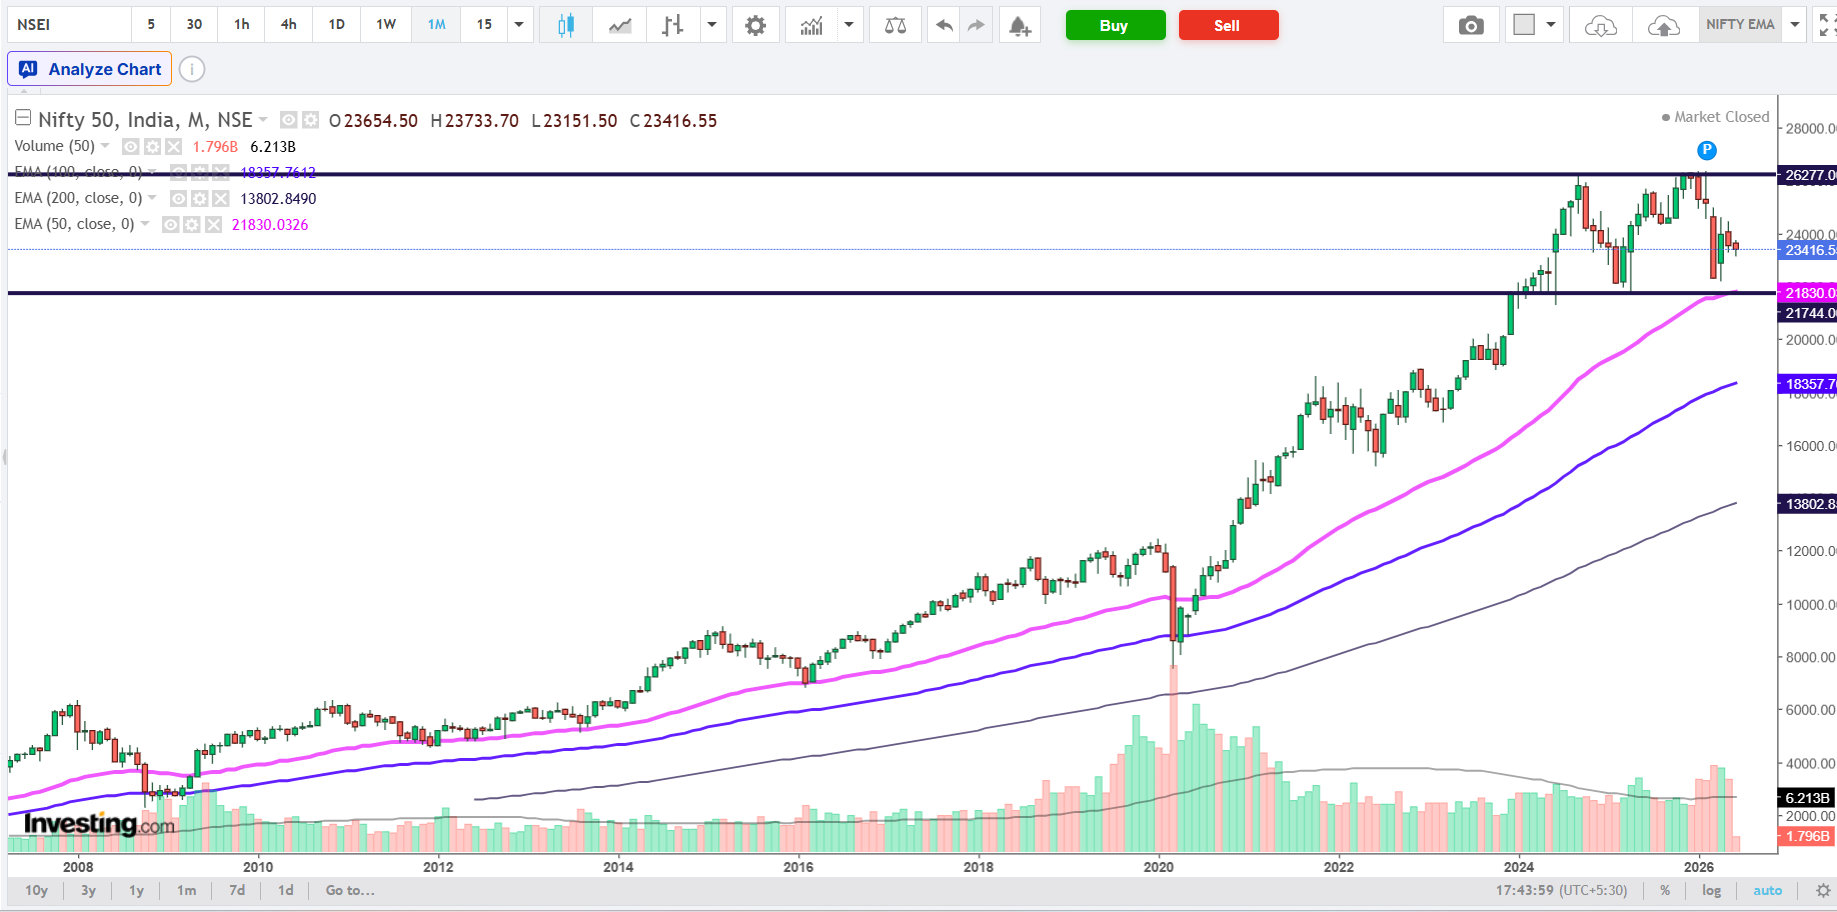
What happened till Josh June Nifty is 23548
Nifty last month did not make the higher high nor the lower low, as Nifty traded in the small range of previous month high and low. The Nifty in April month gave the relief recovery from 22331 to 23998 making the high of 24602 after the stiff fall from 23373 to 22183 during 3 months of lower high lower low. Followed by the May month Nifty went nowhere. The large correction phase in Nifty started from October 2024 & we saw the total damage of 4533 points which is 17.3% damage and the correction stood here for the last 20 Months. This whole 20 Months correction could be seen into 3 different phases + “x” recent recovery phase. Starting with phase “a” that started from October_24 to March_25 where damage of 4533 points 17.3% fall was seen. Nifty made a strong recovery during phase “b” till from April_25 to Decemeber_25 consuming 9 Months & 4629 points which is 100% recovery. Correction Phase “c” thereafter was seen from Jan_26 till March_26 with the fall of 4190 points damaging 15.9% in just 3 Months. Currently from April_26 to May_26 the Nifty is assumed to have entered into the “x” recovery phase months and during this time we saw a strong recovery of 2419 points which is 10.9% recovery. Yes, the Nifty recovered, but for the previous 3 months we have only seen lower low and lower high, we have not yet made the higher high for the last 4 months in a row. Iran_US Conflict have triggered the trade disruptions making the rally in crude towards 120 from mere 55 which is 100% up, giving the spillover effect to USDINR with the rally till almost 96 from 90 and hence damaging the Equity markets world wide with more damage to Asian Markets. The Strategy should be simple: The buying was recommended during the whole correction “a” phase near 22000 previous year also, again as Nifty approaches towards that level buying has been suggested in “c” fall.
What to expect in Josh June Nifty is 23548
After the last 4 months of lower highs in a row, the important level to track this month should be the previous month high 24482. Why? Because making a lower low is normal right now but higher high formation is abnormal for 5 months. Nifty’s strength to move beyond 24482 or failure can set the further trend. Nifty’s strength to move beyond 24482 can help Nifty recover further towards 24983 or even 25485. However, Nifty's failure to move beyond 24482 can drag Nifty lower towards 21828 (50 MEMA) which could be assumed to be strong support of current fall. Hence the level to track closely this month should be 24482 closely for the decisive move ahead. Anyway, stick to the rules: Continue SIP till market is in correction. Buy during falls and avoid buying during rally.
Nifty Josh June Pivot Points: 23764
Resistance: 24266 | 24983 | 25485
Support: 23047 | 22545 | 21828
+ve broader indices for the Coming Months: Midcap_150, Smallcap_250, Microcap_250, Metal, MNC, Pharma
-ve broader indices for the Coming Months:
Crude: CMP: 87.4

For the 2nd month in a row Crude traded in the small range of previous month high and low. We neither saw the higher high nor the lower low for the 2nd Month.
USD INR: CMP: 95.01

USDINR towards a new lifetime high of 96.97, but closed where it opened creating the “doji” candle suggesting indecisiveness. The -ve trend again could re-enter if & only if USDINR fall below 94.05. Watch it closely.
BitCoin: CMP: 73659 (No Value, only Trading)

Buying range could be set at 48000 to 68000 with the near term target of 97838 where some Profits can be booked.
GDP_Q4fy26: Real GDP: 7.83% | Nominal GDP: 9.1%

Real GDP has been estimated to grow by 7.7% in FY 2025-26. Nominal GDP has witnessed a growth of 8.9% in FY 2025-26.
Overall Economic performance in FY 2025-26 is primarily on account of robust Real growth observed in Second Quarter (8.4%), Third Quarter (7.8%) & Now 4th Quarter (7.83%)
Inflation: Increased due to Imported Inlfation.

Fundamentals: Revenue growth and Profit Growth
SALES_ PROFIT
Strong Profit Growth Spike has seen in Q4fy26 which helped close Fy_26 at 20.7% Profit Growth.
Fundamentals: as per current announced earnings and not as per Forwarding earnings.
Dividend Points:

📉 Market volatility is temporary, but look what happens to dividends over 20 years! 🚀
If you only focus on the daily ups and downs of the Nifty 50, you are missing half the story of wealth creation. Let’s talk about a silent compounding machine: Nifty Dividend Points.
Looking at the historical data from image_85c671.png, a fascinating picture of long-term economic resilience emerges:
The Big Picture: Over approximately a 20-year horizon, Nifty dividends grew from 61 points (2006-07) to an estimated 313 points (Est. 2026-27). That is a massive 5.6X growth in payouts! 💰
The Volatility Illusion: In the short term, dividends can fluctuate. We saw drops during major market events like the 2008 global financial crisis (-12% in 09-10), the pandemic era (-21% in 20-21), and the recent correction (-4% in 25-26).
The Coiled Spring Effect: Notice how sharp the recoveries are? After the 2010 drop, dividends jumped 61%. After the 2021 drop, they soared 62%!
Forward Outlook: For FY 2026-27, the estimated dividend stands at 313 points, representing a solid 12% growth over the previous financial year.
The Key Takeaway for Long-Term Investors: Stock prices move on sentiment and macro noise, but corporate payouts reflect hard cash earnings. When you invest for the long term, you aren't just buying a price ticker—you are buying a growing stream of real-world income. 📈
Nifty Intrinsic Value as per current earnings

🔍 Is the Nifty 50 overvalued or undervalued right now? Let's decode the institutional data. 📉
When the market experiences short-term swings, emotional investors panic. But smart investors look at one thing: The Fundamentals.
Looking at our updated long-term model in the image, we analyze 25+ years of Nifty data across GDP, Earnings Per Share (EPS), Book Value, and Fair Value multiples to see where the market is actually heading.
Here are the key structural insights from the updated data:
The Power of Indian EPS Growth: Over the last 25 years, Nifty EPS has compounded at a massive 11.6%. In the last 5 years alone, that pace accelerated to 15.9%! Corporate earnings remain the ultimate engine of stock prices.
Current Market Position (CMP vs. Fair Value): With the current market price hovering around 23,367, the index is trading at an estimated -6.45% discount to its Fair Value.
The Risk-Reward Ratio: According to our Q4_Results matrix, the current market levels offer a 20.5% CMP @ Reward upside compared to a -6.7% CMP @ Risk downside. This still indicates a highly favorable margin of safety for patient, long-term accumulators.
The Road to 2030-37: Looking at our long-term projections based on structural GDP and EPS growth:
EST_2026-27 Blend Fair Value: ~24,978 (Nifty Range: 21,809 to 28,147)
EST_2029-32 Blend Fair Value: ~42,241
EST_2030-37 Blend Fair Value: ~71,578
The Bottom Line: Price is what you pay; value is what you get. Short-term corrections are simply opportunities to buy high-quality compounding assets at a discount to their intrinsic value.
NIFTY INCLUSIONS & EXCLUSIONS:
BSE Ltd can replace Wipro as BSE is 1.7 Lakh Cr v/s Wipro just 58k.
Schedule Of Events

🚀 5 Steps Towards Wealth | Flagship Event - - LIVE - Hyderabad
👉 Register now: https://event.profitfromit.co.in/
📅 Date: 13 June 2026 (Saturday)
🕔 Time: 5:59 PM to 9:00 PM
📍 Venue:
Federation of Telangana Chambers of Commerce and Industry (FTCCI).
FTCCI Surana Auditorium,
11-6-841, FTCCI Marg, Lakdikapul Rd
Hari Nagar, Red Hills
Hyderabad, Telangana 500004
🚇 Nearest Metro: Lakdi-Ka-Pul
🚶 Distance to Venue: 9 minutes walk (650 meters)
🎟️ Entry: FREE (Worth ₹10,000)
Seats are limited. Serious investors only.
Built for long-term investors who want real wealth.
“Someone is sitting in the shade today because someone planted a tree a long time ago.”
If your goal is long-term wealth creation, not short-term noise, this event is for you.
Stop reacting to tips. Start investing with structure, data, and discipline.
🎯 What you will learn:
📈 Smart Investment Strategies – Build a clear, rule-based system
🌍 Economic Insights – Track GDP, inflation, and policy impact
💎 Identify Quality Companies – Strong earnings, high ROE, durable moat
🚀 High-Growth Industries – Spot sectors before expansion phase
⚖️ Value Buying – Buy right, not just buy fast

