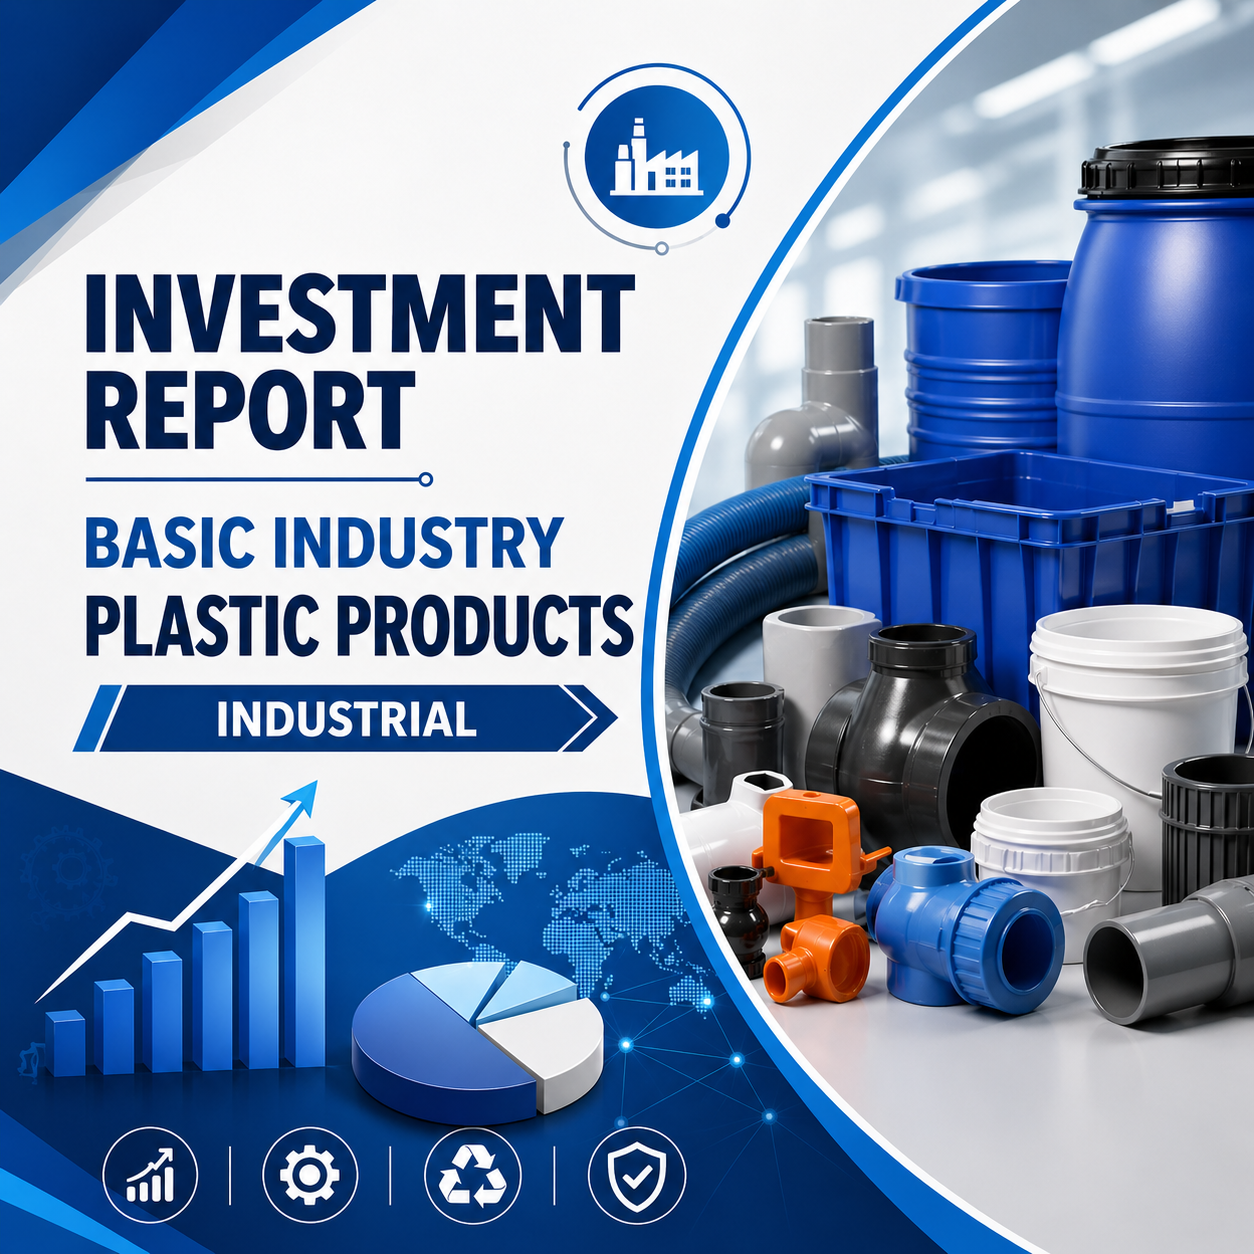
Investment Report: Basic Industry - Plastic Products - Industrial
A Top-Down Fundamental Analysis from Macro-Economy to Micro-Industry
Welcome, investors and students. Today, we are decoding one of the most resilient and wealth-creating pockets of the stock market: Industrial Plastic Products. From the pipes that irrigate our farmlands to the CPVC tubes carrying water through urban skyscrapers, this sector is a silent engine of India's infrastructure boom. Let's break it down from the top.
1. Macro-Economic Sector: Industrials
The Industrials sector encompasses the heavy lifting of a country's economy—manufacturing, infrastructure development, aerospace, defense, and heavy machinery. It is highly sensitive to economic cycles, government capital expenditure (Capex), and private investments.
Key Insights:
China+1 Strategy: Global supply chains are shifting away from China, disproportionately benefiting Indian industrial manufacturing.
Government Capex: The Indian government's massive infrastructure outlay (roads, railways, smart cities) is the primary engine driving this sector.
PLI Schemes: Production Linked Incentives are accelerating domestic manufacturing capabilities.
Explanation:
Think of the Industrials sector as the "engine room" of the global economy. If an economy is a growing body, Industrials represent the bones and muscles. For a beginner, simply understand that when a country builds more factories, roads, and cities, the companies in this sector make the most money.
2. Sector: Capital Goods
Capital Goods are a sub-set of Industrials. These are the machines, tools, equipment, and components used by other businesses to produce consumer goods or provide services.
Key Insights:
Automation & Upgrades: Factories are actively upgrading legacy machinery to automated, energy-efficient systems.
B2B Dependency: This sector thrives on Business-to-Business (B2B) demand rather than direct retail consumers.
Margin Expansion: Due to high entry barriers and complex engineering, established players enjoy immense pricing power.
Explanation:
If a baker sells bread (consumer good), the oven he uses to bake it is a "Capital Good." This sector creates the "tools to make the tools." When corporate India decides to expand its capacity, Capital Goods companies see a massive influx of orders.
3. Basic Industry: Plastic Products - Industrial
This is our core focus today. It includes the manufacturing of polymer-based products like PVC/CPVC pipes, industrial packaging, water tanks, and engineering plastics used across agriculture, real estate, and chemical industries.
Key Insights:
The Big Shift: Metal is rapidly being replaced by high-grade engineered plastics across plumbing, auto, and aviation due to lighter weight and corrosion resistance.
Infrastructure Catalysts: Initiatives like Jal Jeevan Mission and Swachh Bharat are driving volume growth that significantly outpaces global averages.
Real Estate Upcycle: The multi-year housing boom in India is creating a structural floor for demand in plastic building materials.
Explanation:
Industrial Plastics cover everything from the massive PVC pipes buried underground for city sewage to the high-pressure CPVC pipes inside the walls of your home. As India modernizes its housing and agricultural sectors, the demand for durable, rust-free, and affordable plastic products is growing at double digits.
4. Leading Global Companies in Plastic Products
To understand where India is heading, we must look at the global giants dominating the polymer and plastic product spaces.
Key Insights:
Consolidation: Global giants are acquiring smaller regional players to capture emerging market growth.
Sustainability Focus: Western players are heavily investing in biodegradable plastics to fight regulatory headwinds.
Margin Ceilings: Operating margins globally tend to cap out around 14-16% due to the commoditized nature of basic polymers.
Explanation:
Global leaders in this space act as massive refineries of raw materials, turning basic chemicals into specialized parts. They are increasingly looking toward expanding in high-growth, infrastructure-heavy markets like India to offset slower growth in Western markets.
5. Leading Indian Companies (Listed & Unlisted)
The Indian ecosystem is transitioning rapidly from unorganized, local manufacturers to organized, branded national players.
Key Insights:
Market Share Gain: While the base industry grows at ~10%, organized leaders grow at 12-15% because they are eating the market share of smaller, unbranded players.
Brand Premium: Companies like Astral and Supreme can charge a premium because homeowners and plumbers trust the brand name.
Backward Integration: Finolex manufactures its own PVC resin, offering a cost advantage when global resin prices spike.
Explanation:
In India, buying pipes used to be a generic purchase. Today, it is a branded choice. The companies that command the largest distribution networks and the strongest brand recall are capturing the lion's share of India's infrastructure spend.
6. Indian Listed Peers: Market Cap & Sales Overview
Let's size up our domestic listed peers to understand their scale and valuation gaps.
Key Insights:
Valuation Premia: The market rewards growth. Astral's 6.6x P/S reflects the market's belief in its ability to enter new categories like Adhesives and Paints successfully.
Volume Leadership: Supreme is the "Category Killer" in terms of sheer revenue scale.
Value Pockets: Time Technoplast and Finolex trade at significant discounts to the leaders, suggesting potential re-rating if they improve their product mix.
Explanation:
Market Cap tells you what investors hope the company will be worth, while Sales tell you what it is actually doing today. A high Price-to-Sales ratio means the market expects the company to grow very aggressively.
7. Indian Listed Peers: Growth Analysis & Future Logics
Past performance tells us about execution; future logics tell us where the money is headed.
Key Insights:
Diversification: Astral is evolving into a full building materials company, reducing its reliance solely on pipes.
The Rural Factor: Finolex is a direct play on the Indian monsoon and agricultural economy.
Energy Transition: Time Technoplast is a "hidden" play on the CNG and Hydrogen economy through its composite cylinders.
Explanation:
To pick a winner, you look for a "Growth Logic." If India builds more houses, Supreme wins. If India moves to green gas, Time Technoplast wins. If the rural farmer has more money, Finolex wins.
8. Indian Listed Peers: Core Financials & [EBITDA Margins & Realization per Tonne]
Key Insights:
Pricing Power: Astral’s ₹185,000 realization per tonne shows its superior ability to pass on costs to consumers.
Efficiency: Supreme’s 21.2% ROCE proves it is a well-oiled machine that generates massive returns on every Rupee invested.
Specialization: Shaily Engineering focuses on high-precision plastics for healthcare, giving it the highest margins in the group.
Explanation:
EBITDA Margin is the "pure" profit from business operations. Realization per Tonne is the average price the company gets for selling 1 unit of its product. Higher realization usually means a better, more premium product.
9. Indian Listed Peers: Solvency & Liquidity
Key Insights:
Fortress Balance Sheets: The top companies in this sector carry almost no debt, making them extremely safe investments during high-interest periods.
Self-Funded Growth: Because they generate so much Free Cash Flow, they don't need to dilute shareholders to build new factories.
Explanation:
Debt-to-Equity tells us if the company is living on borrowed money. In this sector, the winners are the ones who don't need the banks to grow.
10. Final Verdict: Best Company for the Long-Term
The undisputed winner for a core long-term portfolio is Supreme Industries Ltd (509930).
Why Supreme Industries?
Scalability: They are building massive capacity that will make them nearly twice as large as their nearest competitor by 2028.
Profitability at Scale: Maintaining such high ROCE at ₹11,000 Cr+ revenue is a sign of a high-quality management "Moat."
Valuation: It offers a more balanced entry point compared to its peers while offering similar growth potential.
Aggressive Runner-Up: Time Technoplast (532856)
For those seeking "Alpha," Time Technoplast is the play on India's energy transition. Their composite cylinders are a disruptive technology that could see exponential adoption in the next 5 years.
Disclaimer: This report is for educational and informational purposes only. We are a SEBI Registered Investment Advisor (RIA), but this document does not constitute personalized financial advice. Equity investments are subject to market risks. Please consult with your dedicated financial planner and review all company filings before making any investment decisions. Data provided is as of April 2026 and subject to market fluctuations.

