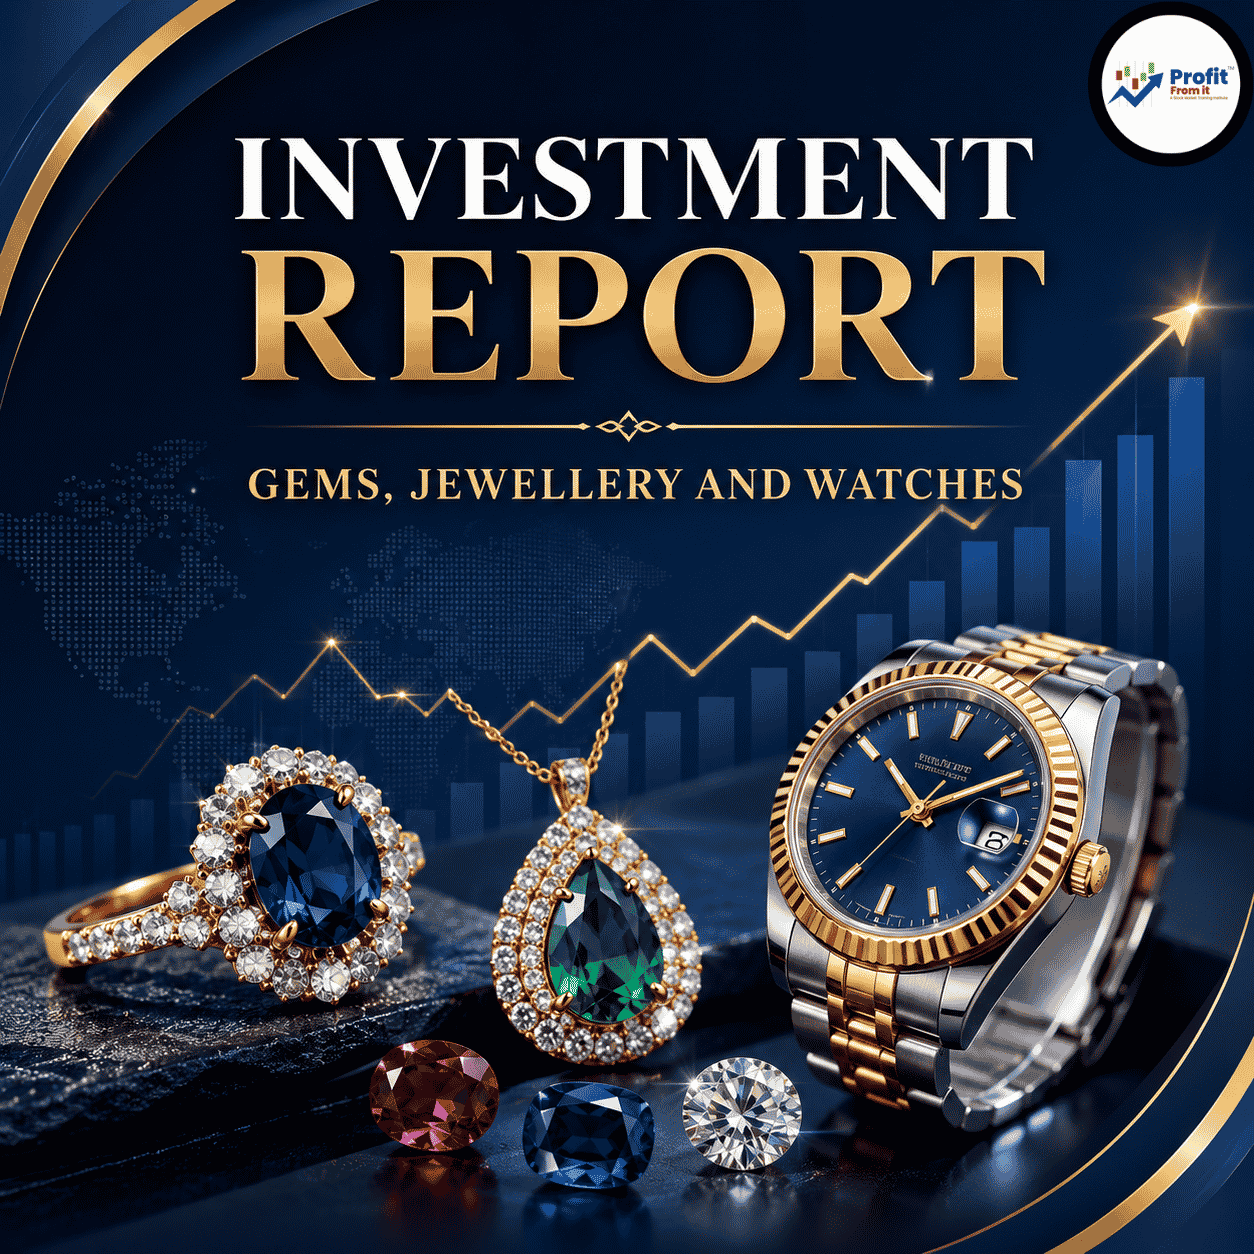
Investment Report: Gems, Jewellery And Watches
A Top-Down Fundamental Analysis from Macro-Economy to Micro-Industry
1. Macro-Economic Sector: Consumer Discretionary
The Consumer Discretionary sector comprises industries that sell non-essential goods and services. It is highly sensitive to economic cycles, domestic GDP expansion, middle-class income growth, and shifting consumer psychology toward luxury, status, and lifestyle.
Market Size & Projections
Key Insights
The GDP Trigger: As India's per-capita income crosses the threshold of $2,500 towards $4,000, "discretionary" spends grow at a multiple of GDP growth, shifting household budgets from pure survival/savings items to lifestyle enhancement.
Premiumization Trend: Consumers are showing a strong preference for branded, high-quality products over unbranded, commoditized alternatives.
Favorable Demographics: A young median age of ~28 years, dual-income households, and urban migration act as secular tailwinds.
Explanation for Beginners
What is Consumer Discretionary? This sector represents "good-to-have" items rather than "must-have" items (like food or basic utility bills). When people have extra money after paying for their necessities, they spend it on discretionary things like travel, designer clothing, high-end watches, and fine jewelry. It is an excellent proxy for a country's economic health and middle-class wealth creation.
2. Sector: Consumer Durables
The Consumer Durables sector consists of products that do not wear out quickly and yield utility over a long period. In India, this includes home appliances, electronics, and personal durables like premium watches and jewelry.
Market Size & Projections
Key Insights
Unorganized to Organized Shift: Tax reforms (GST), mandatory hallmarking, and consumer trust are aggressively shifting market share from local neighborhood shops to organized, national brands.
Increasing Financing Penetration: The proliferation of No-Cost EMIs, consumer credit, and digital payment frameworks has structurally reduced the ticket size barrier for aspirational purchases.
Tier-2 & Tier-3 Penetration: High-speed internet penetration and physical store expansions by organized brands are unlocking massive demand in non-metro geographies.
Explanation for Beginners
What is Consumer Durables? These are products that you buy once and use for several years (usually more than 3 years). In our context, watches and precious jewelry are classified here because they are not consumed instantly. Instead, they retain or even grow in value over time and are worn over multiple years, making them both personal assets and lifestyle products.
3. Basic Industry: Gems, Jewellery And Watches
This industry represents highly culturally rooted, high-value personal assets. In India, gold jewelry is not merely fashion; it is treated as an alternative currency, a household insurance policy, and an indispensable part of weddings and festivals. Simultaneously, watches have evolved from simple timekeeping devices into status symbols and high-end fashion statements.
Market Size & Projections
Key Insights
The Wedding & Festival Backbone: Over 50% of the domestic jewelry demand in India is driven by weddings. This structural demand makes the industry incredibly resilient to global macro shocks.
Smart Wearables vs. Premium Horology: While entry-level analog watches face competition from smart fitness bands, the premium-to-luxury watch segment (handled by companies like Titan and Ethos) is witnessing exponential growth and margin expansion.
The Trust Premium: The government's push for 100% mandatory hallmarking of gold jewelry has dealt a severe blow to under-caratage practices by unorganized jewelers, steering consumers directly toward trustworthy, institutionalized retail chains.
Explanation for Beginners
What is Gems, Jewellery & Watches? This industry involves the designing, manufacturing, and retailing of gold, platinum, and silver jewelry, diamond-studded ornaments, and wristwatches (ranging from basic utility watches to ultra-luxury collectibles). It is a unique sector where emotional value, cultural tradition, investment value, and fashion trends intersect.
4. Leading Global Companies in Gems, Jewellery And Watches
Global Peer Comparison
Key Insights
The Moat of Heritage: Global luxury giants like Richemont and LVMH command exceptional operating margins (20%+) because consumers pay a heavy premium for brand heritage and craftsmanship rather than raw materials.
Consolidation of Retail: The global landscape is increasingly consolidating around vertically integrated giants that control everything from sourcing to exclusive boutique retail.
Sustainability and Lab-Grown Diamonds (LGDs): Western markets are rapidly adopting lab-grown diamonds due to ethical and affordability reasons, a trend that is beginning to influence Indian premium design houses.
Explanation for Beginners
Why look at global companies? By analyzing international leaders, we can understand where the Indian market is heading. Western markets show that as consumers grow wealthier, they migrate from buying plain bullion (raw metal) to buying specialized, high-margin brand designs. It also shows us the massive margin potential if Indian companies successfully transition from raw gold retailers to lifestyle design brands.
5. Leading Indian Companies (Listed & Unlisted)
The Indian ecosystem features a mix of institutionalized conglomerates, aggressive regional chains scaling nationally, and fast-growing digital-first brands.
Domestic Landscape
Key Insights
Titan is the Unrivaled Giant: Titan (backed by the Tata Group) commands a near-monopoly on institutional trust in India, capturing a massive chunk of both the jewelry and organized watch markets.
Malabar's Unlisted Muscle: Malabar Gold & Diamonds is a massive unlisted player that poses serious competition in terms of raw revenue, though it operates on lower retail margins compared to Titan's high-value designer portfolio.
Niche Players Capitalizing on Premiumization: Ethos operates on a highly profitable luxury distribution model, acting as the exclusive gateway for global luxury watch brands entering the Indian market.
Explanation for Beginners
Why does listed/unlisted status matter? Listed companies trade publicly on the stock exchanges, meaning their financial books are fully open, auditable, and accessible to retail investors. Unlisted players are private, but understanding their size helps us comprehend the competitive intensity. Players like Malabar and Joyalukkas show that while Titan is the market leader, the unorganized-to-organized transition has ample room to support multiple massive brands.
6. Indian Listed Peers: Market Cap & Sales Overview
This section maps out the public market landscape of Indian jewelry and watch giants to understand who holds the market power and how they are valued.
Valuation & Scale Table
Key Insights
The Titan Valuation Premium: Titan trades at a highly premium P/E (~71x) compared to its competitors like Kalyan (~26x). This is because the market rewards Titan’s superior return ratios, Tata pedigree, massive cash flows, and its dual dominance in watches and jewelry.
Kalyan’s Value Play: Kalyan Jewellers offers a much cheaper alternative on a Price-to-Sales basis (1.33x vs Titan’s 4.14x). As Kalyan transitions to a capital-efficient franchise model (FOCO), it is set for structural rerating.
Ethos’ Luxury Multiple: Ethos trades at a high P/E of ~65x because it occupies a niche luxury space with virtually no listed competitors and has a high billing value per customer.
Explanation for Beginners
What is Market Cap and Price-to-Sales? Market Cap is the total value of all of a company's shares. Price-to-Sales (P/S) tells us how much the stock market is willing to pay for every single Rupee of sales the company makes. Titan's high P/S indicates that investors believe its sales are of "high quality" and will yield highly predictable profits, whereas Thangamayil's low P/S suggests the market views it as a regional, lower-margin bulk player.
7. Indian Listed Peers: Growth Analysis & Future Logics
Revenue growth is the single most important engine for wealth creation. Here, we look at historical growth and compare it with future triggers.
Growth Metrics & Investment Thesis
Key Insights
Titan’s Landmark Year: Titan crossed the historic ₹75,000 Cr revenue milestone in FY26, achieving the last ₹25,000 Cr of growth in a single year. This highlights its immense scaling velocity.
Kalyan’s Accelerated Run-Rate: Backed by its "My Kalyan" localized marketing network and FOCO showrooms, Kalyan is growing its top-line faster than Titan in percentage terms, making it a powerful catch-up play.
Ethos Riding the High-Net-Worth Wave: The explosive increase in Indian billionaires and multi-millionaires directly feeds into Ethos’ premium watch distribution network.
Explanation for Beginners
What is CAGR? CAGR stands for Compound Annual Growth Rate. Think of it as the steady yearly rate at which a business grows its sales as if it were compounding like a bank deposit. A 20% CAGR means the company is doubling its sales roughly every 3.6 years!
8. Indian Listed Peers: Core Financials & Industry-Specific KPIs
In the Gems, Jewellery, and Watches industry, traditional financial metrics must be accompanied by specialized operating metrics to judge real retail health.
Industry-Specific KPI Definitions
Gold Inventory Turn (Times): How fast a jeweler can buy raw gold, manufacture jewelry, sell it, and convert it back to cash. High turn reduces exposure to gold price volatility.
Share of Studded Jewellery (%): Diamond and gemstone-studded jewelry carries gross margins of 30-35%, compared to plain gold jewelry which carries 8-12%. A higher studded ratio dramatically improves profitability.
Same-Store-Sales-Growth (SSSG %): Measures growth in sales from existing stores open for more than a year. It proves whether the brand is genuinely loved or if it is only growing by opening new stores.
Financials & Industry KPIs (FY26 / Latest TTM)
Key Insights
The Studded Moat of Titan: Titan’s superior profitability is directly linked to its high studded ratio (30%). Tanishq has successfully positioned diamonds as an aspirational, modern design choice.
EBITDA Superiority in Watches: Ethos boasts a high EBITDA margin of 14.5% because premium watches carry luxury markups that jewelry retailers can rarely extract on plain gold transactions.
Inventory Turnover Velocity: Titan’s supply chain efficiency allows it to rotate its gold inventory nearly 4 times a year, meaning it protects itself from sudden crashes in gold spot prices much better than its peers.
Explanation for Beginners
Why do these KPIs matter? Imagine two jewelry shops. Shop A sells only plain gold bars on a tiny profit margin and takes one year to sell its stock. Shop B sells designer diamond rings with a huge profit margin and sells out its stock every three months. Even if Shop A has larger total sales, Shop B will be vastly wealthier and safer. That is why we track "Studded Share" and "Inventory Turn."
9. Indian Listed Peers: Solvency & Liquidity
Jewelry retailing is working-capital intensive because stores must hold highly valuable physical gold and watch stock on their shelves before selling them. Therefore, checking balance sheet strength is critical to ensure a company won't crumble under debt.
Balance Sheet Health
Key Insights
Titan’s Cash Fortress: Titan maintains a very clean balance sheet with a Debt-to-Equity ratio of just 0.27x and excellent cash flow generation, allowing it to easily finance its aggressive global and domestic store rollouts.
Kalyan’s Deleveraging Journey: Kalyan historically carried heavy debt to build its initial showroom network. Thanks to the transition to the asset-light FOCO model, Kalyan’s Debt-to-Equity has dropped and its cash generation has surged.
Ethos’ Prudent Capital Allocation: Ethos operates with almost zero debt (0.08x), funding its premium watch acquisitions and boutique leases through equity and internal accruals.
Explanation for Beginners
What is Debt-to-Equity and Interest Coverage? Debt-to-Equity measures how much borrowed money (debt) a company is using to run its business compared to its own money (equity). A ratio below 0.5x is highly safe. The Interest Coverage Ratio tells us how many times over the company can pay its annual interest bill using its operating profits. A higher number means the company is completely safe from defaulting on its loans.
10. Final Verdict: Best Company for the Long-Term
🏆 The Undisputed Winner: Titan Company Ltd. (TITAN)
Based on a holistic top-down fundamental analysis, Titan Company Ltd. emerges as the undisputed crown jewel for long-term compounding. No other Indian competitor matches Titan's combination of brand equity, corporate governance, and execution capability.
Core Investment Thesis for Titan:
The Trust Moat (Tata Pedigree): In an industry historically plagued by under-caratage and tax evasion, the "Tata" brand is an irreplaceable psychological advantage. Consumers buy from Tanishq with absolute peace of mind.
High-Margin Studded Dominance: With a 30% studded jewelry share, Titan enjoys superior gross margins that feed directly into a robust 25.8% Return on Capital Employed (ROCE).
The CaratLane Engine: CaratLane gives Titan an early mover advantage in the digital-first, affordable, and lightweight jewelry market preferred by millennials and Gen Z.
The Global Opportunity: Tanishq is successfully expanding its footprints in international markets (USA, Middle East, Singapore) to capture the affluent NRI (Non-Resident Indian) demographic.
🚀 Aggressive Runner-Up (High Risk / High Reward): Kalyan Jewellers India Ltd.
For investors with a higher risk tolerance looking to capitalize on a massive turnaround story, Kalyan Jewellers is an excellent pick.
Why Kalyan Jewellers?
By shifting to the FOCO (Franchise-Owned Company-Operated) model, Kalyan is successfully offloading the heavy capital expenditure of inventory and store space onto franchise partners. This transition is dramatically boosting their return ratios, freeing up cash flows to pay down debt, and accelerating store expansions in high-growth regions of North, West, and Central India. Trading at a steep valuation discount compared to Titan, Kalyan offers significant potential for valuation re-rating.
⚠️ Disclaimer
This investment report is compiled by a SEBI Registered Investment Advisory entity. The content provided herein is strictly for educational, informational, and training purposes for stock market students and workshop attendees. It does not constitute direct buy, sell, or hold recommendations. Investing in equity markets involves significant risk, including potential loss of principal. Investors are strongly advised to perform their own due diligence before making any investment decisions. Past performance is not indicative of future results.

