📈 H1 FY26 Internet & Catalogue Retail Industry – Investor Insights | Profit From It
profitfromit1@gmail.com
Whatsapp

📈 H1 FY26 Internet & Catalogue Retail Industry – Investor Insights

Lesson 29/90 | Study Time: 20 Min
📈 H1 FY26 Internet & Catalogue Retail Industry – Investor Insights

📈 H1 FY26 Internet & Catalogue Retail Industry – Investor Insights

🌐 Industry Overview

The Internet & Catalogue Retail industry delivered healthy sales growth (+11.6% H1, +7.4% Q2) in FY26. However, profitability diverged sharply across companies, with Naukri’s margin expansion driving industry-level profit growth (+35.9% H1, +46.9% Q2) while peers faced compression.


💰 Market Capitalization Landscape

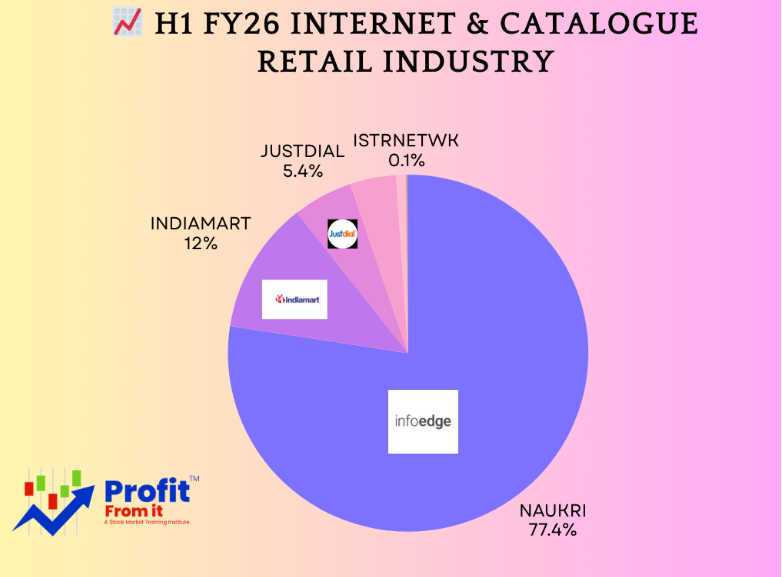
  • Naukri dominates with ₹86,451 Cr market cap, commanding 76.6% of industry share.

  • Indiamart follows at ₹13,907 Cr (12.3%), while JustDial holds ₹6,293 Cr (5.6%).

  • Smaller players (Crizac, Matrimony, Istrnetwk, Jupiterin, OlympTX, JSHL) collectively contribute less than 6% of industry capitalization.

📊 Implication: Industry performance is heavily concentrated in Naukri, making it the anchor for fund positioning.


📊 Comparative Growth Analysis

🔹 H1 FY26

  • Naukri: Sales +13.1%, Profit +101.2% 🚀

  • Indiamart: Sales +12.4%, Profit -5.2% ⚠️

  • JustDial: Sales +6.2%, Profit -5.4% ⚠️

  • Industry Aggregate: Sales +11.6%, Profit +35.9%

🔹 Q2 FY26

  • Naukri: Sales +5.7%, Profit +313% 🚀

  • Indiamart: Sales +12.7%, Profit -39.3% ⚠️

  • JustDial: Sales +6.7%, Profit -22.7% ⚠️

  • Industry Aggregate: Sales +7.4%, Profit +46.9%

📌 Observation: Naukri’s profit surge offsets declines in Indiamart and JustDial, sustaining industry-level earnings growth.


📉 Margin Dynamics

  • Naukri: Margin expanded from 19.7% → 35.0% (H1) and 9.2% → 35.9% (Q2)

  • Indiamart: Margin compressed from 36.7% → 30.9% (H1) and 38.9% → 20.9% (Q2)

  • JustDial: Margin fell from 52.2% → 46.5% (H1) and 54.2% → 39.3% (Q2)

  • Industry: Margins improved in H1 but declined in Q2, reflecting mixed company-level trends.


⚖️ Weighted Impact Table (H1 FY26)

Company

Weight %

Sales Growth %

Weighted Sales Impact %

Profit Growth %

Weighted Profit Impact %

Naukri

76.6

13.1

+10.0

101.2

+77.5

Indiamart

12.3

12.4

+1.5

-5.2

-0.6

JustDial

5.6

6.2

+0.3

-5.4

-0.3

Others

5.5

NA

~0.0

NA

~0.0

Industry

100

11.6

+11.6

35.9

+35.9

📌 Takeaway: Naukri alone explains nearly all of the industry’s profit growth, while peers dilute earnings momentum.


🎯 Strategic Positioning for Investors

  • Overweight Naukri (🚀): Margin expansion and profit momentum make it the clear driver of industry earnings.

  • Neutral Indiamart (⚖️): Strong sales but profitability drag; monitor cost structures.

  • Underweight JustDial (⚠️): Limited upside contribution, consistent margin pressure.

  • Satellite exposure to smaller names (🌱): Too small to materially impact industry aggregates; treat as opportunistic bets.


🌍 Global Internet Retail Industry

  • Amazon (FY25/26): Market cap ~$2.3 trillion; revenue ~$575 billion FY25. Net profit ~$30 billion, margins ~8–10%.

  • Alibaba (China): Market cap ~$200 billion; FY25 revenue ~$130 billion, profit ~$13 billion. Margins ~10%.

  • Pinduoduo (China): FY25 revenue ~$35 billion, profit ~$7 billion, margins ~20% (higher efficiency model).

  • Industry averages (global e-commerce): Gross margin ~47%, EBITDA margin ~20%, operating margin ~9%.

🛒 Unlisted Indian Giants

  • Flipkart (FY25): Revenue ₹82,787 Cr (~$10 bn), Loss ₹5,189 Cr. FY24 revenue ₹70,542 Cr, Loss ₹4,248 Cr.

    • Despite strong sales (boosted by Big Billion Days), profitability remains negative due to discounting and logistics costs.

  • Amazon India: Not separately disclosed, but India is one of Amazon’s fastest-growing markets. Globally, Amazon’s e-commerce sales exceeded $575 bn FY25, with India contributing significantly to growth.

🔑 Comparative Insights

  • Scale vs Profitability: Global leaders (Amazon, Alibaba) operate at massive scale with sustainable margins. Indian listed firms are smaller but show sharper swings in profitability due to margin volatility.

  • Flipkart vs Amazon India: Flipkart drives volume but remains loss-making; Amazon India benefits from global scale and AWS profitability cushioning retail margins.

  • Investor positioning:

    • Indian listed firms: Naukri is margin-resilient; Indiamart/JustDial face cost pressure.

    • Global giants: Amazon offers scale + profitability; Alibaba/Pinduoduo show regional strength.

    • Unlisted Flipkart: Growth engine but structurally loss-making—strategic exposure only via Walmart (parent).


📝 Conclusion

The Internet & Catalogue Retail industry in H1 FY26 is a story of sales resilience but profit divergence. With Naukri’s outsized contribution, industry-level earnings remain strong, but investors should be selective—focusing on margin-resilient leaders while staying cautious on peers facing cost pressures.


Research by: Kinjal Bhatt

Declaration: The information presented in this report is based on publicly available data and internal analysis as of H1 FY26. While every effort has been made to ensure accuracy, the insights are intended for informational purposes only and do not constitute investment advice.

Piyush Patel

Piyush Patel

Product Designer
4.83
Faithful User
Expert Vendor
Golden Classes
King Seller
Fantastic Support
Loyal Writer
Profile

Class Sessions

1- Various companies in the healthcare services industry, specifically focusing on their market capitalization, sales for the year 2024, and profits for the same period: 2- 📊 November 2024 Eight Core Industries: Detailed Analysis, Beneficiary Stocks & Industries 📊 3- Report on Indian Banking Sector at a Glance: 4- *2025 to be the year of electric vehicles*: 5- The Bharat Mobility Global Expo 2025 has showcased a remarkable array of product launches and industry advancement: 6- Coffee industry 7- Leading companies in the Computer-Software consulting industry: 9M_Fy25 Results Update 8- 🌐 🇮🇳 Indian Private Banking Industry – Long-Term Investment Analysis (2025) 🚀 9- Capital Shift: RBI Revises Risk Weights, Transforming Bank-NBFC Dynamics 10- 🏡 Housing Finance Industry Overview (India & Global) + 2035 Outlook 🚀 11- 🚗 Indian Auto Industry - February 2025 Report: Investor Insights 📊 12- 📊 Indian Retail Sector Analysis: Compare Dmart, Reliance Retail & global giants on revenue, profitability & growth. Best long-term investment for FY2035! 🚀💰 13- Tanks, Tech & Trillion-Dollar Dreams: The Rise of India's Defence Might: 14- 💼 How to Invest in India’s Booming Mutual Fund Industry – February 2025 Analysis + Stock Picks 15- 🚁 HAL’s ₹62,700 Cr LCH Deal: India’s Defence Sector Enters a New Orbit 16- India’s food processing sector is entering a golden era 17- ⚡ Powering India 2035: The Energy Sectors Set to Explode 18- 🌞 Waaree Energies Powers India’s Solar Future: A 5.4 GW Gamechanger for Long-Term Investors 19- 🏢 REITs in India: A Complete Investor Guide – Comparison, Insights & Global Benchmarks 20- Decoding the Nifty 500 Segment Landscape: FY25 Insights & Highlights 21- 🌟 Special Consumer Services in India: FY25 Insights 22- 🚆 Riding the Rails of Opportunity: How RailOne and Railway Modernization Are Driving Multi-Sector Investment Themes 23- 🧠 Investor takeaways from Asian Paints’ 79th AGM (FY25) 24- 📊 Indian Consulting Software Industry Analysis 2025: Top Companies, Growth Outlook & Investment Insights 25- 🚀 India’s Infrastructure Revolution: Path to FY2035 Growth 26- 📊 Private Sector Banks H1 FY26 – Quality Growth & Investment Insights 27- 📊 Household Appliances Industry – Investor Quality Datasheet 28- 👔 Garments & Apparels Industry – H1 FY26 Investor Insights 29- 📈 H1 FY26 Internet & Catalogue Retail Industry – Investor Insights 30- 📊 Public Sector Banks: H1 FY26 Investor Insights 31- 🏥 Hospital Industry FY26 – Investor Insights 32- ✈️ H1/Q2 FY26 Tour & Travel Services Industry – Investor Insights 33- 🎨 Indian Paint Industry: H1 FY26 Performance & Global Context 34- ♻️ Waste Management Industry – H1/Q2 FY26 Investor Blog 35- 📊 Amusement Parks & Recreation – H1 FY26 Investor Datasheet 36- 🚗🔧 Auto Components & Equipments Industry – H1 & Q2 FY26 Investor Insights 37- The Great Tech Pivot: Why India’s $280B IT Industry Is No Longer Just a Service Desk 38- 📉 The "IT Red Sea": A Structural Pivot to the Next $800B Opportunity 39- Specialty Retail 2026: The $1.6 Trillion Opportunity Decoding India’s Next Multi-Bagger Sector 40- Strategic Financial Analysis of the Education Industry 2025-2030: Market Size, Listed Peers, and Long-Term Growth Prospects 41- 📶 The Telecom Renaissance: Building Wealth in the Digital Lifeline of India 42- Ultimate Aerospace & Defense Industry Report: Global Trends & Top Stocks for Long-Term Wealth 43- Electrical Equipment Industry Report 2026 | Top Stocks & Growth 44- Cables & Electricals Industry (2026): Comprehensive Investment Report: 45- Investment Report: Basic Industry - Explosives 46- Investment Report: Basic Industry - Industrial Products 47- Investment Report: Basic Industry - Compressors, Pumps & Diesel Engines 48- Investment Report: Basic Industry - Abrasives & Bearings 49- Investment Report: Basic Industry - Construction Vehicles 50- Investment Report: Basic Industry - Computers - Software & Consulting A Top-Down Fundamental Analysis from Macro-Economy to Micro-Industry 51- Investment Report: Telecom - Infrastructure 52- Investment Report: Basic Industry - Port & Port Services 53- Investment Report: Basic Industry - Water Supply & Management 54- Investment Report: Basic Industry - IT Enabled Services 55- Investment Report: Basic Industry - General Insurance 56- Investment Report: Basic Industry - Asset Management Company (AMC) 57- Investment Report: Basic Industry - Life Insurance 58- Other Financial Services 59- Investment Report: Basic Industry - Private Sector Bank 60- Investment Report: Basic Industry - Packaged Foods 61- Investment Report: Basic Industry - Consumer Electronics 62- Investment Report: Basic Industry - Power Generation 63- Investment Report: Basic Industry - Power Exchange 64- Investment Report: Basic Industry - Power Transmission 65- Investment Report: Basic Industry - Housing Finance Company 66- Investment Report: Basic Industry - Other Bank (Small Finance Banks) 67- Investment Report: Basic Industry - Plastic Products - Industrial 68- Investment Report: Basic Industry - Passenger Cars & Utility Vehicles 69- Investment Report: Basic Industry - E-Retail / E-Commerce 70- Investment Report: Basic Industry - Non-Banking Financial Company (NBFC) 71- Investment Report: Basic Industry - Other Electrical Equipment 72- Investment Report: Basic Industry - Healthcare Service Provider 73- Investment Report: Basic Industry - Ceramics 74- Shipbuilding & Allied Services 75- Investment Report: Basic Industry - Depositories, Clearing Houses, and Other Intermediaries 76- Investment Report: Basic Industry - Diversified Retail 77- Investment Report: Basic Industry - Residential & Commercial Projects 78- Investment Report: Basic Industry - Civil Construction 79- Investment Report: Basic Industry - Tractors 80- 🏍️ The Ultimate Investment Guide: India's 2 & 3 Wheeler Industry (2026) 81- Investment Report: Basic Industry Amusement Parks/Other Recreation 82- Investment Report: Basic Industry - Specialty Chemicals 83- Investment Report: Basic Industry - Tyres & Rubber Products 84- Investment Report: Gems, Jewellery And Watches 85- Investment Report: Basic Industry - Public Sector Banks 86- Investment Report: Basic Industry - Tea & Coffee 87- Investment Report: Basic Industry - Hotels & Resorts 88- Solar Industries India Limited Q4 FY26 Analysis 89- Investment Report: Basic Industry - Software Products 90- Investment Report: Basic Industry - Pesticides & Agrochemicals
💬 Chat with us!
Logo

Join & Start Learning Today

Already registered? Login here

Start Profiting Now!

Welcome, there!
Your account is active. Enjoy full access.

Redirecting