📊 Amusement Parks & Recreation – H1 FY26 Investor Datasheet
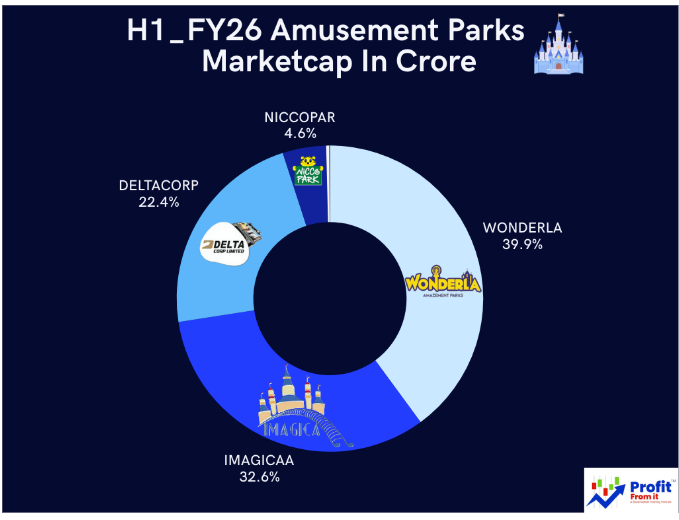
🏢 Market Cap & Industry Share
📈 Sales Growth (H1 & Q2 FY26)
🟢 Wonderla → H1 +3.3%, Q2 +19.4%
🟡 Imagicaa → H1 −15.3%, Q2 +5.1%
🟢 Delta Corp → H1 +1.7%, Q2 +0.6%
⚪ Industry → H1 −2.4%, Q2 +5.6%
💰 Profit Growth (H1 & Q2 FY26)
🟡 Wonderla → H1 −111.6%, Q2 −34.2%
🔴 Imagicaa → H1 −91.5%, Q2 +533% (off negative base, not sustainable)
🟡 Delta Corp → H1 −26.0%, Q2 −34.2%
🔴 Industry → H1 −47.6%, Q2 −131.4%
📉 Margin Trends
Wonderla → H1 margin 20.6% (−11.9 pp), Q2 margin −2.2% (−24.6 pp)
Imagicaa → H1 margin 2.6% (−23.8 pp), Q2 margin −92.7% (−77.3 pp)
Delta Corp → H1 margin 14.8% (−5.5 pp), Q2 margin 13.7% (−7.2 pp)
Industry → H1 margin 13.7% (−11.8 pp), Q2 margin −4.9% (−21.2 pp)
🏆 Quality Lens (Operational)
🟡 Wonderla → Scale leader, strong sales, but margin repair needed.
🟢 Delta Corp → Best margin stability, debt-free, steady revenues.
🔴 Imagicaa → Weak liquidity, high leverage, volatile profits.
🌍 Global Peers
High-quality benchmarks: Disney Parks, Universal Parks, Oriental Land (Tokyo Disney).
Cyclical comparables: Six Flags, Cedar Fair, SeaWorld.
Diversified operators: Merlin Entertainments, Parques Reunidos.
Emerging market analogs: OCT, Fantawild, Chimelong (China).
🚦 Traffic-Light Recommendation
🟢 Wonderla Holidays → Core holding (scale + growth, watch margins).
🟢 Delta Corp → Defensive quality (margin stability, debt-free).
🔴 Imagicaa → limit (weak quality, high risk).
Investor takeaway
Wonderla Holidays → Best “scale” candidate; invest once margin repair is visible.
Imagicaa → too much volatility and weak quality signals.
Global peers → Disney/Universal/Oriental Land are benchmarks for scale + quality; Six Flags/Cedar Fair are comparables for cyclical, leveraged models.
Research by Kinjal Bhatt
📜 Disclosure
This note is for informational purposes only and does not constitute investment advice.

