Timken India Q4 FY26 Analysis: Historic Revenue Breakout vs. Margin Contraction Pressures
Welcome to another edition of our quarterly earnings teardown. In this update, we dissect the Q4 FY26 performance of Timken India Ltd. While the top-line numbers hit a historic milestone, a deeper look under the hood reveals margin pressures that warrant a classic 'Margin of Safety' approach. Let's dive into the consolidated numbers.
The Snapshot
The 'Wow' Factor
Historic Top-Line Milestone: Revenue officially breached the INR 1,000 Cr threshold for the very first time in a single quarter, clocking in at INR 1,073.14 Cr.
Stellar Sequential Bounce: The company showcased an explosive Quarter-on-Quarter recovery, with Profit After Tax (PAT) surging by 210.5%.
DII Conviction: Domestic Institutional Investors (DIIs) have aggressively accumulated the stock, pushing their stake past 30.6%, absorbing the historical offloading by FIIs.
Operational KPI Table
For industrial bearing manufacturers, top-line growth must be weighed against operational efficiency. Here are the core metrics:
Financial Deep Dive
Here is the consolidated financial breakdown comparing Q4 FY26 with both the previous quarter (QoQ) and the same quarter last year (YoY).
Cost vs. Efficiency Analysis
While the $14.2\%$ YoY revenue growth is a testament to strong demand and Timken's pricing power, the $-17.1\%$ YoY contraction in PAT reveals the true operational narrative. Calculating the margins via $EBITDA\ Margin = \frac{EBITDA}{Revenue} \times 100$, we see that inflationary input costs and operating overheads have eaten into the bottom line. The management's tone in transcripts remains cautiously optimistic—confident about long-term capacity expansions and AI-driven automation demand (echoing their US parent, The Timken Co.), but defensive regarding immediate raw material volatility. The Q3 to Q4 efficiency recovery is commendable, but YoY cost scaling remains a concern.
Peer Benchmarking & Valuation Guardrails
How does Timken stack up against its closest rival, Schaeffler India?
P/E Ratio: Timken currently trades at a P/E of 68.9 times, while Schaeffler India trades at approximately $50.9 times.
P/B Ratio: Timken's P/B stands at 9.23 times.
Valuation Verdict: Trading at a Premium. Compared to its own 5-year median P/E (historically hovering around the 40 times - 45 times range) and its peers, the stock has priced in a significant amount of future growth.
The Forward Curve
Based on management guidance and capacity expansion (investing 12% of revenue back into infrastructure), we project a normalized sequential revenue growth of 5% - 8% over the next two quarters. The impending integration of the Timken GGB merger will be a critical catalyst to watch for operational synergies.
Shareholding Dynamics
There has been a definitive shift in institutional hands:
Promoter Stake: Unchanged at $51.05\%$, with zero shares pledged.
DII Accumulation: Mutual Funds and DIIs have consistently raised their stakes over the past year, currently sitting at $30.63\%$.
FII Stabilization: FII holding has stabilized at $6.96\%$, stemming the massive sell-offs witnessed in earlier quarters.
Key Risks and Red Flags
As analysts focused on capital preservation, we must highlight a prominent red flag: The Artech International Litigation. The company is currently contesting a civil suit filed by former distributor Artech International before the Calcutta High Court worth INR 107.86 Cr. While management does not anticipate immediate financial impairment, an adverse ruling could severely impact short-term cash flows. Additionally, heightened US-Iran geopolitical tensions driving up Brent crude prices pose a macroeconomic risk to industrial input costs.
The Advisory Note
Strategic vs. Tactical Outlook:
Strategic (Long-Term): Timken's debt-free status, parent company backing, and consistent double-digit CAGR outperforming the broader Indian bearing market make it a resilient compounder for patient capital.
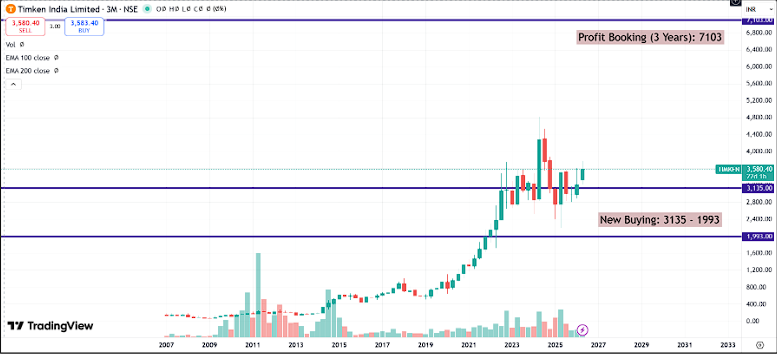
Tactical (Short-Term): Given the steep 68.9 times earnings multiple and YoY margin compression, there is no immediate Margin of Safety. We advise tactically avoiding fresh entries at current levels and waiting for broader market corrections to accumulate near the 200-DMA support levels ( INR 3,175).
Financial Disclosure: This analysis is for educational and informational purposes only. We are acting as corporate investment advisors. Data is accurate as of the June 2026 earnings release.

