C.E. Info Systems Ltd (MapmyIndia) Q4 & FY26 Analysis: Decisive Q4 Sequential Inflection vs. Elongated Working Capital Cycles
1. The Snapshot
2. The "Wow" Factor
V-Shaped Q4 Turnaround: After a muted first nine months, Q4 FY26 delivered an exceptional sequential turnaround, with Revenue from Operations surging by +54.8% QoQ, absolute EBITDA expanding by +141.9% QoQ, and PAT skyrocketing by +171.3% QoQ.
IoT SaaS Margin Record: EBITDA margins in the IoT-led business surged to a historic high of 33% in Q4 FY26 (up from 19% in Q4 FY25), driven by an optimized product mix with high-margin SaaS-led recurring revenues representing 66% of the IoT segment.
Swelling Moat Runway: MapmyIndia's Open Order Book grew by +17% YoY to close at an all-time high of INR 1,754.4 Crores, implying a highly secure 3 to 4 years revenue visibility runway.
Fortress Balance Sheet: The firm holds an unleveraged cash reserve of INR 685.0 Crores (including cash, bank balances, and mutual fund investments), providing massive capital allocation comfort despite deploying INR 120.0 Crores for inorganic and working capital growth.
3. Operational KPI Table
To understand the core structural growth, we track the following sector-specific operational metrics:
4. Financial Deep Dive (Consolidated Data)
The consolidated financials show a stark contrast between a hyper-growth sequential quarter and a stabilizing, consolidating full-year transition.
Cost vs. Efficiency Analysis
From a "Margin of Safety" perspective, MapmyIndia's full-year performance highlights margin compression. Full-year EBITDA margins compressed by 200 bps to 37.0%, while PAT contracted by -9.2% YoY.
This bottom-line contraction is primarily driven by:
Subcontracting Outlays: Technical services outsourcing and project software costs escalated from INR 63.6 Cr to INR 75.4 Cr as the government business was transitioned to the wholly-owned subsidiary, Mappls DT.
Higher Working Capital Capitalization: The firm capitalized INR 16.5 Cr of employee benefits under internally developed intangible assets, reflecting heavy R&D efforts.
Surging Employee Overhead: Attrition increased to 14%, pushing overall corporate employee benefit expenses to INR 90.8 Cr.
While sequential metrics show operational efficiency, the rising cost structure of its lower-margin hardware IoT operations demands ongoing cost controls.
5. Management Integrity & Tone Analysis
The management transcript reveals a transparent, highly realistic, and long-term oriented leadership tone.
Rather than adopting a defensive posture regarding the muted full-year revenue growth (+2.3%), CMD Rakesh Verma and MD Rohan Verma addressed structural bottlenecks directly. They quantified the exact customer-side delays that impacted the financial numbers:
A major automotive IoT contract worth INR 20.0 Crores was delayed into Q1 and Q2 FY27 due to regulatory compliance processes and fleet readiness issues rather than MapmyIndia's execution capability.
A large Emergency Response System B2G contract was pushed sequentially because the state government delayed system readiness.
Furthermore, management highlighted their flawless credit history in the B2G space, stating they have experienced almost zero bad debt write-offs in government contracts, which validates their selective bidding strategy.
6. Peer Benchmarking: MapmyIndia vs. Genesys International
How does MapmyIndia perform against its closest listed geospatial peer, Genesys International Corporation Ltd?
Strategic Takeaway:
While Genesys International delivered higher top-line growth ($+10.2\%$ vs $+2.3\%$), MapmyIndia is structurally superior. MapmyIndia generated over four times the net profit of Genesys with a far cleaner working capital cycle ($119 \text{ days}$ vs $226 \text{ days}$ DSO) and an unleveraged, cash-surplus balance sheet.
7. Key Risks & Red Flags
Receivables Dilution (Working Capital Drag): Consolidated trade receivables escalated from INR 133.0 Cr to INR 176.0 Cr. Cash conversion cycles are stretching due to B2G client structures, impacting operating cash flow.
Inventory Obsolescence Risk: To support upcoming IoT demand, MapmyIndia increased inventory days from 77 to 107 days. If client execution delays persist, the firm faces inventory write-downs.
B2G Revenue Unpredictability: Government business is highly vulnerable to bureaucratic timelines, resulting in sequential volatility and a lack of predictable quarter-on-quarter mapping.
8. The Forward Curve (Projections)
Management has guided for a structural return to its historical approx 20% to 24% growth trajectory in FY27, backed by the execution of delayed B2G and B2B automotive IoT orders.
Using historical conversion patterns, we project the following consolidated revenues for the next two quarters:
Projected Q1 FY27 Revenue approx INR 115 Cr} - INR 120 Cr
Projected Q2 FY27 Revenue approx INR 125 Cr - INR 130 Cr
This projection is supported by the INR 20 Cr deferred automotive IoT contract and the state Emergency Response system starting billing in early FY27.
9. Valuation Guardrails
Trailing P/E Ratio:
P/E = CMP/ EPS = 839.65/24.56 approx 34.19x.
5-Year Median P/E: Historically situated between 55x and 60x.
Valuation Classification: Historically Discounted. While trading at a premium to standard IT services companies, MapmyIndia is trading at a significant discount to its historical valuation multiples, providing a comfortable margin of safety for entry.
10. Shareholding Pattern Highlights
Promoter Group Stake: Remains solid at 51.41% Crucially, there are zero pledged shares by the promoters.
Anchor Institutions: PhonePe Limited remains the largest strategic non-promoter institutional shareholder with a 13.65% stake.
Institutional Backing: Tata Mutual Fund (via Tata Small Cap Fund) holds a robust 5.11% stake, reflecting high institutional confidence.
11. The Advisory Note
Strategic Outlook (Long-Term Thesis):
MapmyIndia holds a dominant digital mapping moat in India. Its proprietary "Digital Twin Metaverse" platforms, combined with deep integration inside Automotive OEMs (e.g., Maruti e-Vitara, Mahindra 7X0, Tata Motors Sierra EV), create incredibly high switching costs. As automotive ADAS adoption increases and urban digital twin mapping becomes standard, MapmyIndia remains a structural compounder.
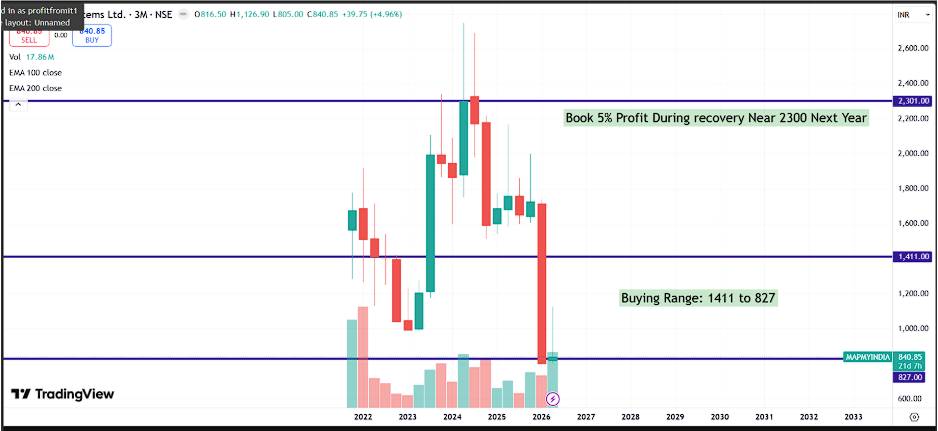
Tactical Outlook (Short-Term Opportunity):
With the valuation compressing to approx 34.

