Coverage:
What we discussed Marvelous March
What happened in Marvelous March
What to expect in Amazing April
Nifty Pivot Points.
+ve broader indices for the coming months.
-ve broader indices for the Coming Months:
Fundamentals
Nifty Intrinsic Value as per current earnings
Schedule Of Meetings
Indices View Nifty
What We Discussed in Marvelous March: Nifty is 22125
Considering the lower high lower low the pending target of 21716 - 21844 could be seen. But assuming the completion of 2 months fall time wise and triggered targets of 21716 - 21844 price wise, huge buying can be seen from this level. We may see strong recovery towards 23253 to even 23807. We have not seen the Nifty making Monthly high for the last 2 months. But if Nifty moves beyond 23807 then the recovery could be extended towards 24381 or even 24955. Hence the level to track this month should be the range of 21716 to 21844 which are out pending targets. The strong recovery “x” phase for 5 months timewise and near to 25908 price wise could be seen from this range. Anyway, stick to the rules: Buy during falls and avoid buying during rally.
What happened in Marvelous March: Nifty is 23519
As discussed last month Nifty made the lower low of 21965 and strong recovery was seen from there till 23870 as expected. Last month was the 1st month for Nifty making the higher high after the lower low for 2 months. Till now during the previous 5 months of downward correction we saw the net damage of 4312 points which is 16.4% damage. Initially we saw the fall “a” starting from October month with the correction of 2 months time wise and 3014 price wise which was a 11.5% fall. This fall “a” was followed by “b” recovery phase which lasted for just a month and 1595 points. Lastly we saw the “c” phase which was assumed & lasted for 2 months with the damage of 2893 points which is 11.6% fall. We have been assuming a strong supportive target zone of 21844 to 21716. The fall during the “c” phase we saw was till 21965 which was near to the target support zone of 21844 - 21716. Last month after making the low we saw the strong recovery till 23870 which is 1905 points and 8.7%. We saw the Nifty making a higher high after 2 months, but still Nifty was not strong enough to close above previous months high 23807, this suggests a cautious approach during the recovery. Anyway, buying has been recommended in the whole range of 21844 to 21716 as we were expecting near to 5 months recovery which can take Nifty towards 25907. Yes, Nifty entered into “x’ recovery phase last month. For the last 2 quarters Nifty made the lower high lower low and last quarter ended with the indecisive “doji” candle.
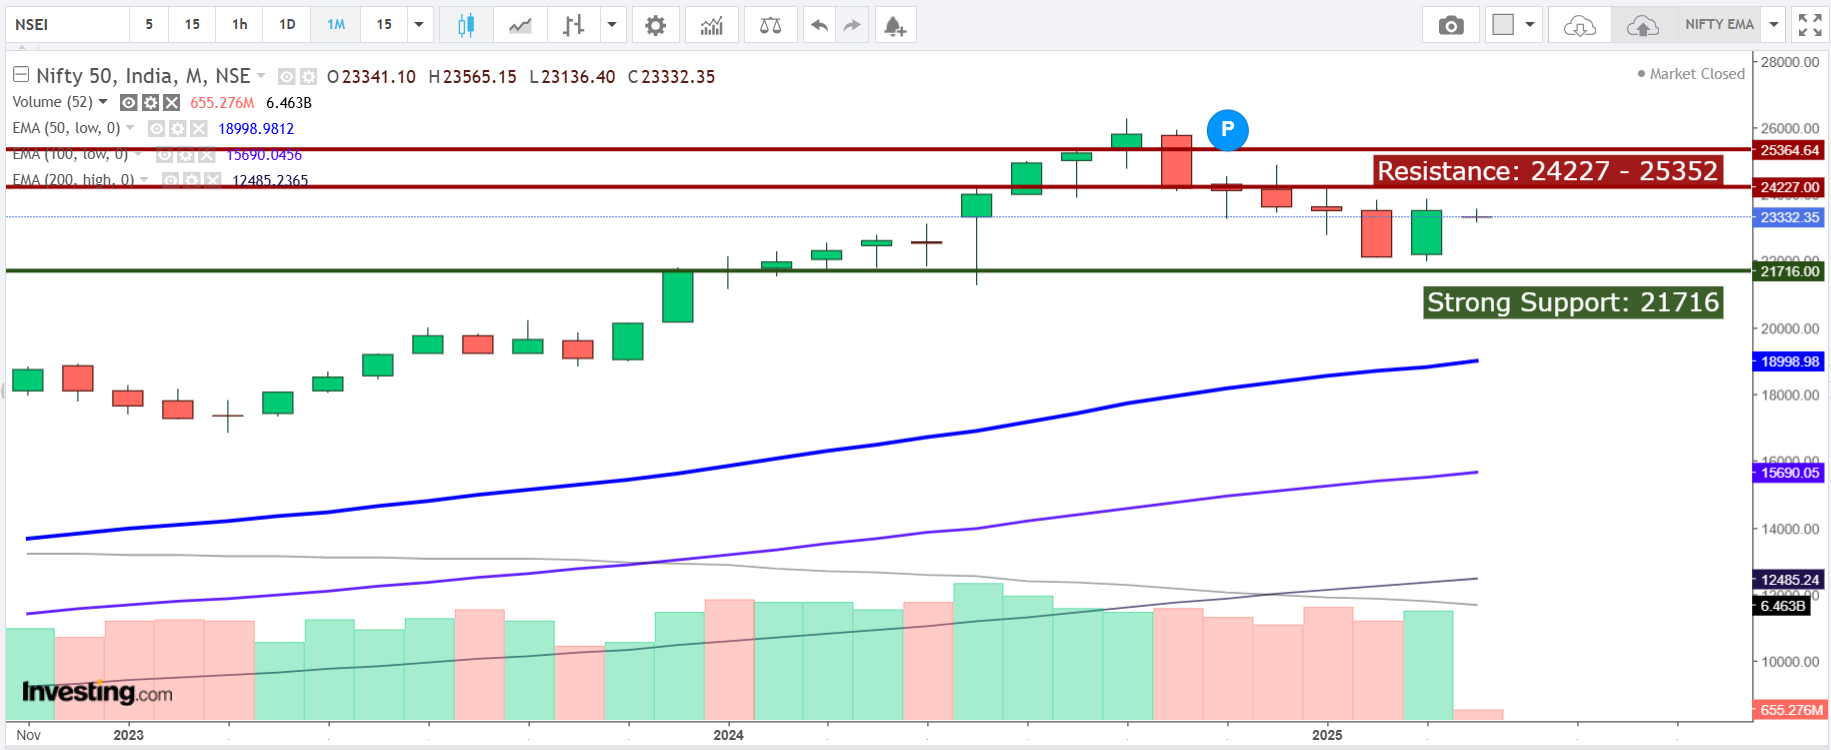
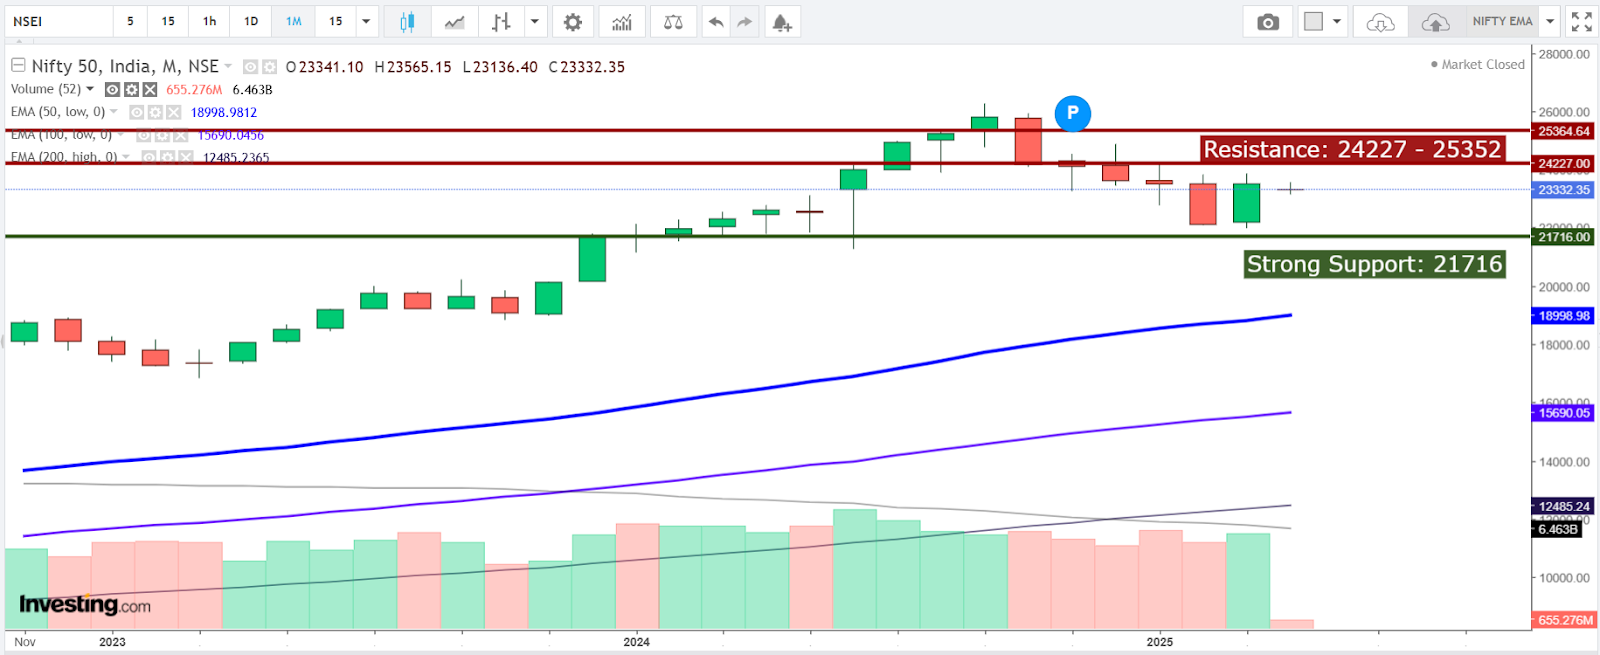
What to expect in Amazing April: Nifty is 23519
Considering Nifty making lower highs and lower lows for the 2nd quarter in a row with the overall fall of 4312 points, but Nifty with the “doji” candle at the closing of the quarter suggesting in-decisiveness during the fall. Considering the “doji” candle, the most important level to track not only this month but for the next 3 months should be the high of the previous quarter and that is 24227. Any recovery till 24227 should be treated as the normal bounce back and profit booking attempt must seen here. Strong recovery “x” phase for 5 months timewise and price wise 25023 or even 25352 could be seen if & only if Nifty could move beyond 24227 else bias could be flat to -ve. Nifty’s inability to move beyond 24227 can drag Nifty back towards 22366 form where again buying can be expected. Overall, on the lower side still the target of 21716 stays pending which is the strongest support in near term. Hence the level to track for next 3 months should be 24227 for a decisive move ahead. Anyway, stick to the rules: Buy during falls and avoid buying during rally.
Nifty Amazing April Pivot Points: 23118
Resistance: 24271 | 25023 | 26176
Support: 22366 | 21213 | 20461
+ve broader indices for the Coming Months: Nifty_Bank, Commodities, Fin_Services, Infra, Metal, Value_20, Private_bank,
-ve broader indices for the Coming Months: Nifty_IT,
*Nifty Bank:* CMP: 51565
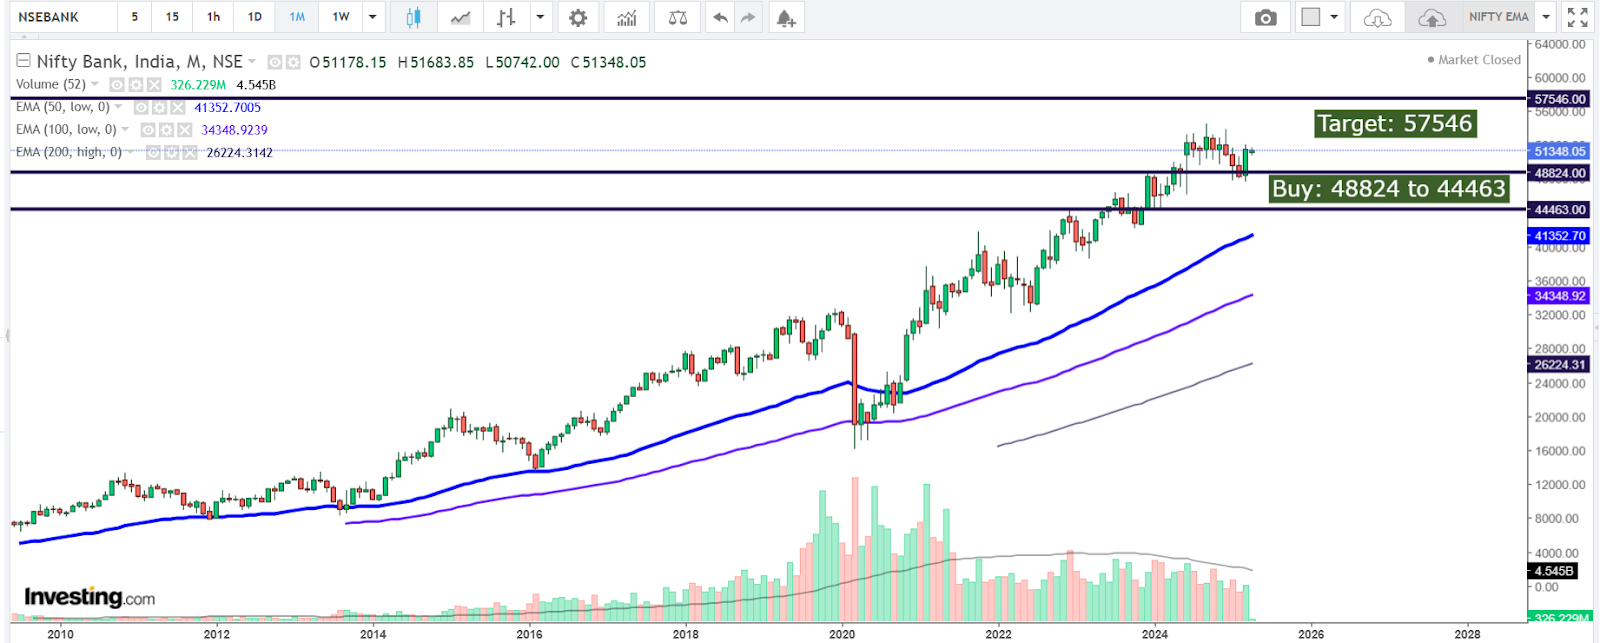
Whole range of 48824 to 44463 should be considered as the strong buying range with the target of 57546 in the next few months.
*USD INR:* CMP: 85.45

The strength in the Rupee could be seen with the USDINR towards 84.7, 84 to even 82.7 in the next few months.
BitCoin: CMP: 102424 (No Value, only Trading)
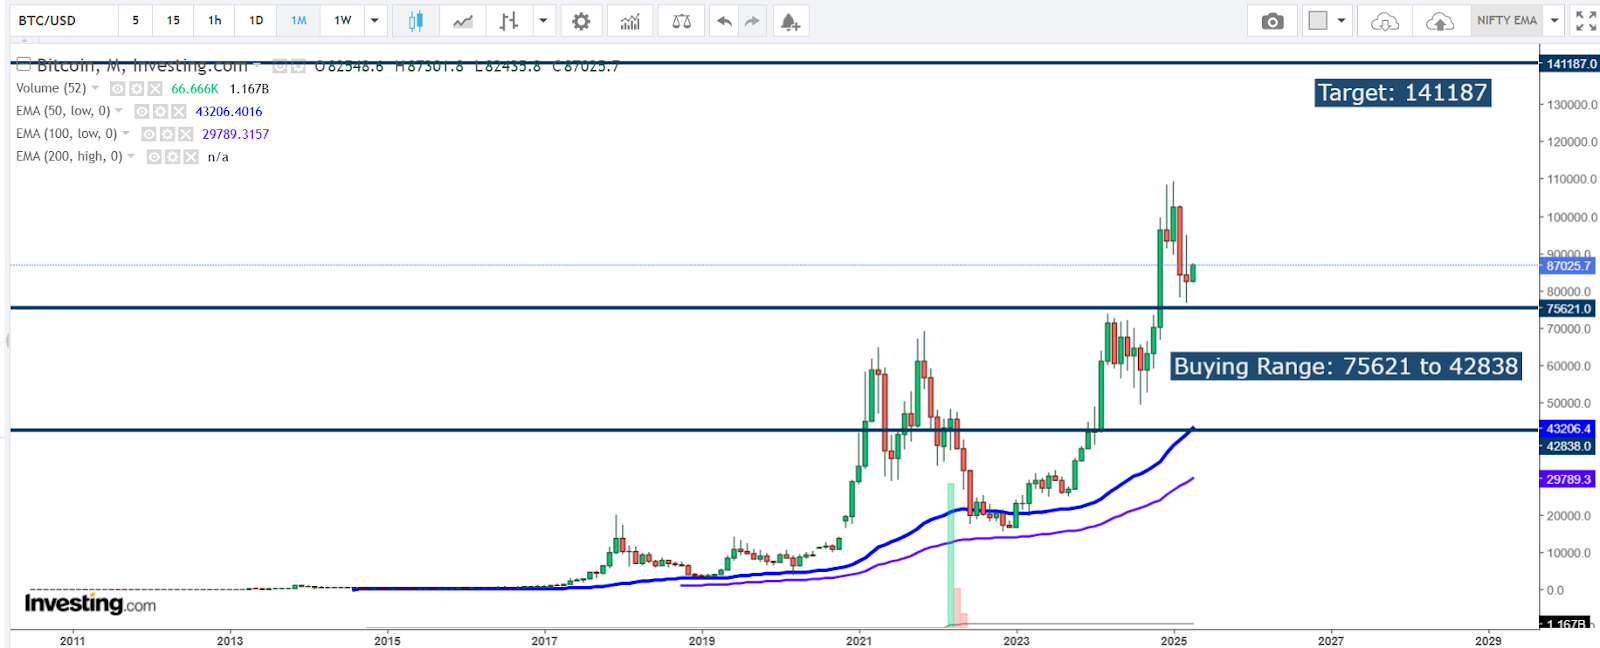
New Buying can be done during the whole range of 75621 to 42838 all with the target of 141187 in the next 12-15 months.
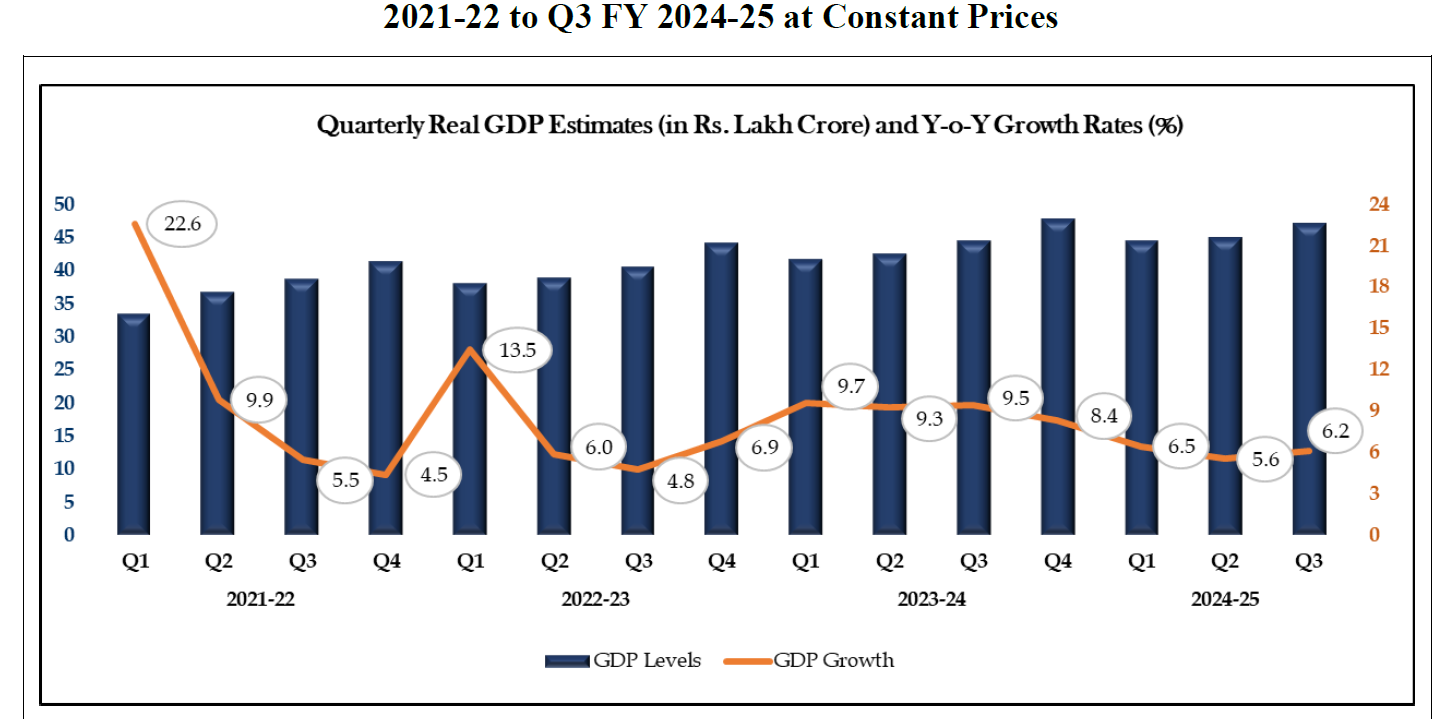
GDP: Demand Muted
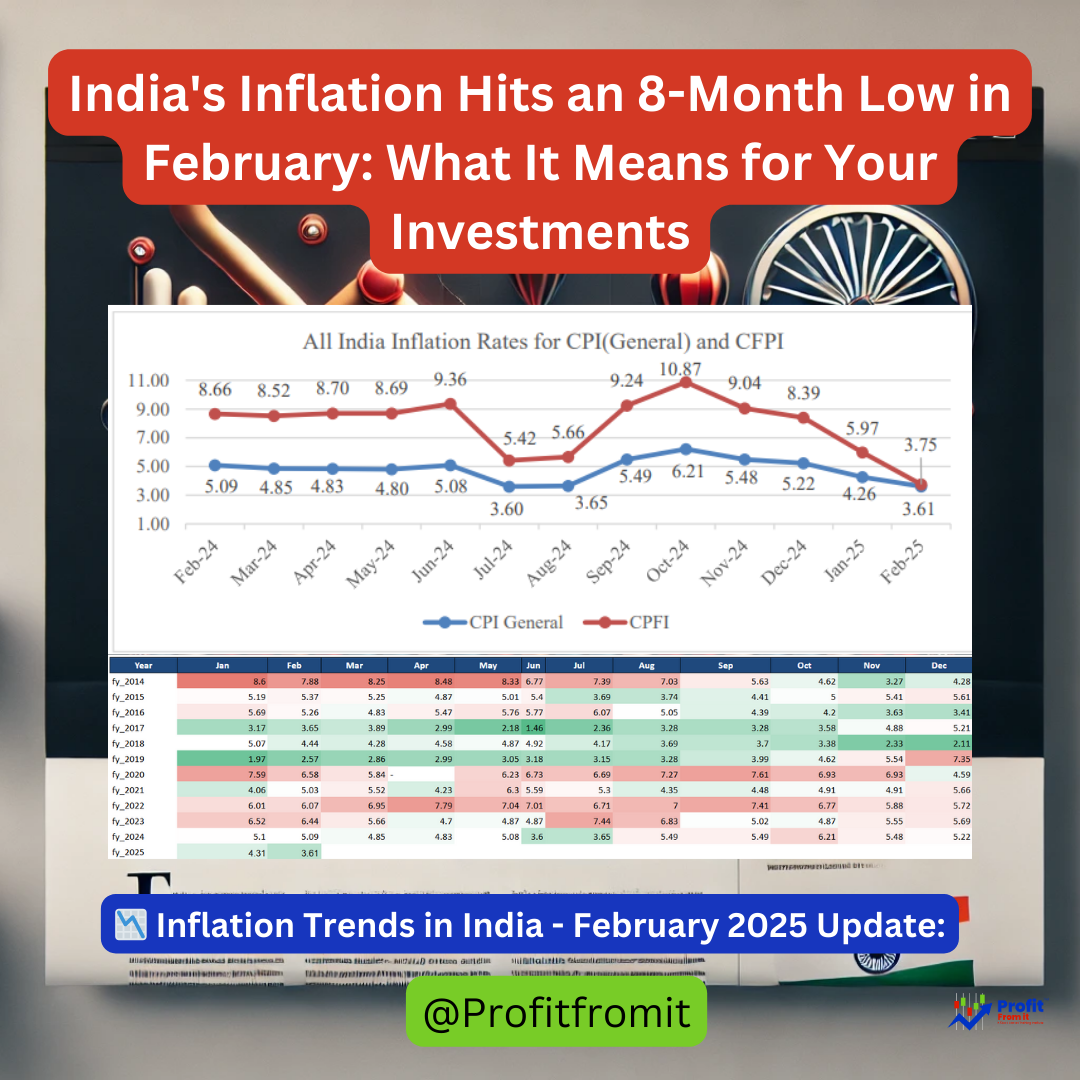
Inflation: Cooled Off
Fundamentals: fy24 Revenue growth and Profit Growth
SALES_ PROFIT_ Margin & VALUATIONS:
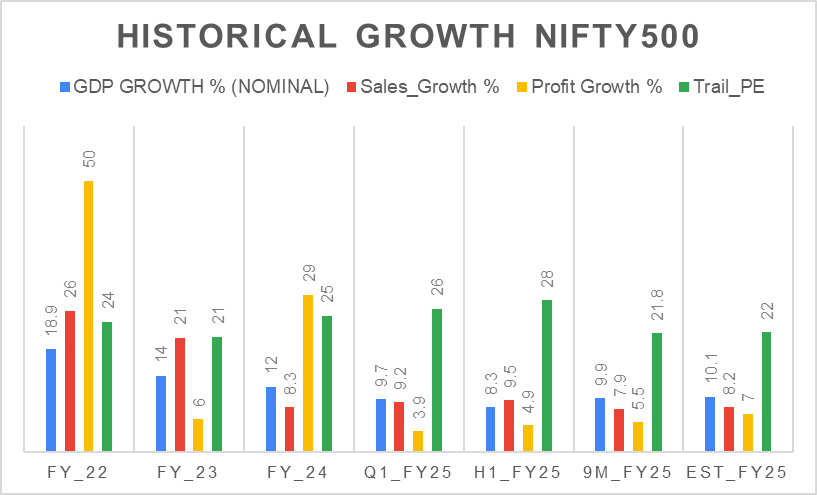
Based on the provided chart showing the Nifty 500 Sales and Profit Growth trends, here are the key insights for investors:
FY22 (Post-COVID Recovery):
Sales Growth: 26%
Profit Growth: 50%
The post-COVID recovery witnessed strong growth in both sales and profits due to pent-up demand and a low base effect. This period contributed to a significant market rally.FY23 (Impact of Global Events):
Sales Growth: 21%
Profit Growth: 6%
Inflationary pressures due to the Russia-Ukraine war significantly impacted profit margins. Despite moderate sales growth, profits were muted, causing market corrections during this period.FY24 (Recovery and Growth):
Sales Growth: 8%
Profit Growth: 29%
Recovery in sales and profitability led to renewed investor confidence and a market rally.FY25 (Current Year Trends):
Q1:
Sales Growth: 9%
Profit Growth: 4%
H1:
Sales Growth: 10%
Profit Growth: 5%
Muted sales growth and declining profit trends are evident. This reflects challenging market conditions, potentially due to high-interest rates, inflation, or subdued demand, resulting in market corrections.9M:
Sales Growth: 7.9%
Profit Growth: 5.5%
Muted sales growth and declining profit trends are evident. This reflects challenging market conditions, potentially due to high-interest rates, inflation, or subdued demand, resulting in market corrections.
Investor Takeaways:
Post-COVID Surge: Take advantage of recovery periods with high growth due to low bases and demand surges.
Global Headwinds: Monitor geopolitical events and inflationary pressures that can significantly affect profitability.
Current Year Challenges: A cautious approach is advised as sales and profit growth are subdued, indicating slower economic momentum. Focus on sectors showing resilience or counter-cyclicality.
Investors should diversify and align portfolios with macroeconomic trends, focusing on quality companies with strong fundamentals for long-term growth.
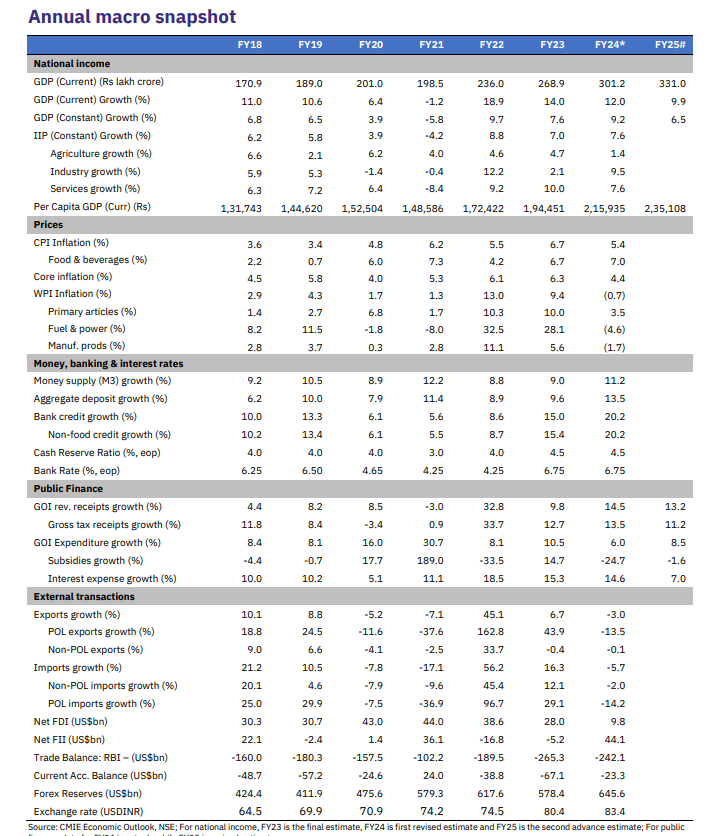
ANNUAL MACRO INDIA:
Nifty Dividend Points:
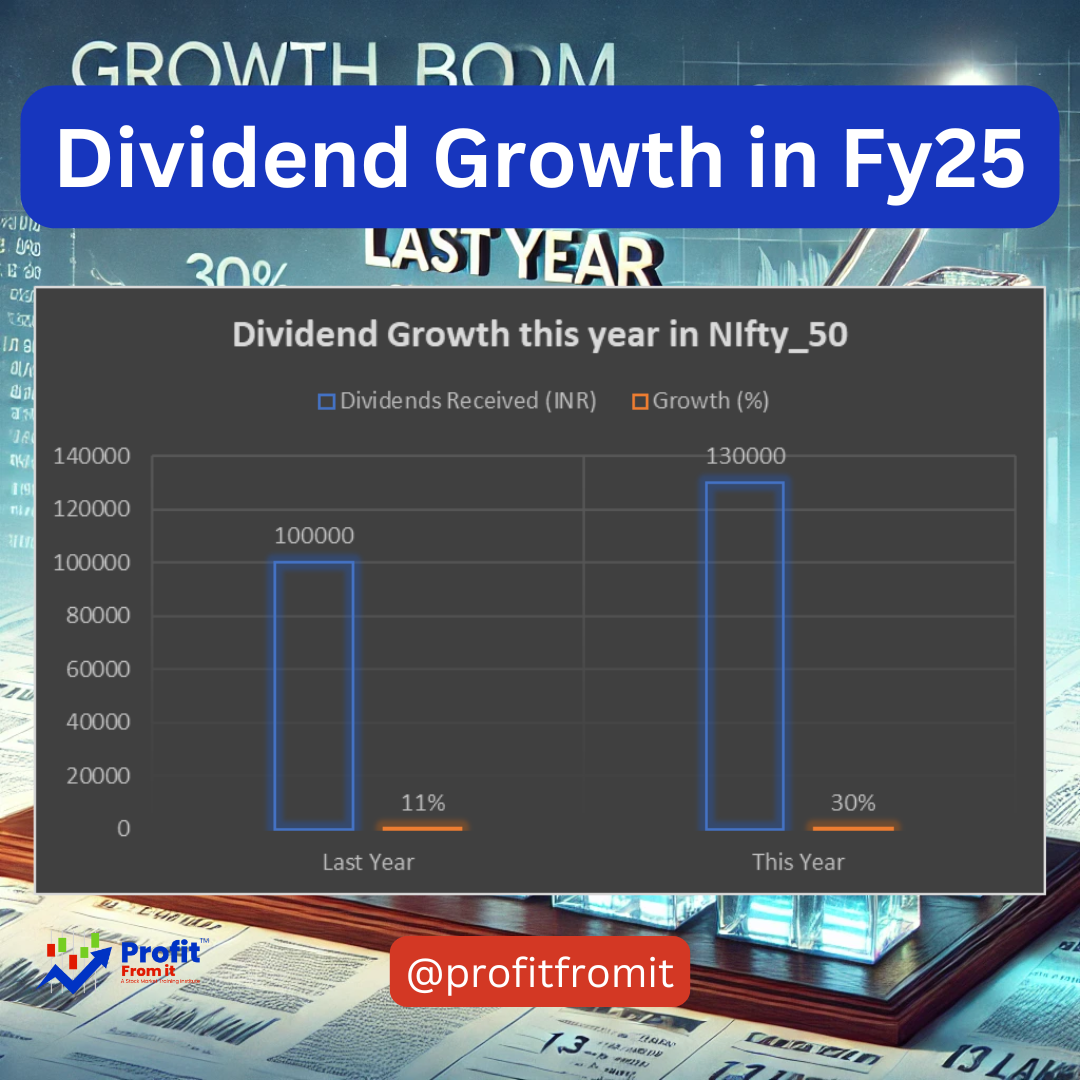
Actual Dividends Received This year in comparision to last Year 11% has grown by 30%. If Investor received 1 Lakh Dividends Last year this year they should have receive 1.3 lakh for Nifty50 Companies. (As last year Profits were 29% high, Q1Fy25 Got 45% Dividend inflow which gave overall boost to Fy25 Dividends)
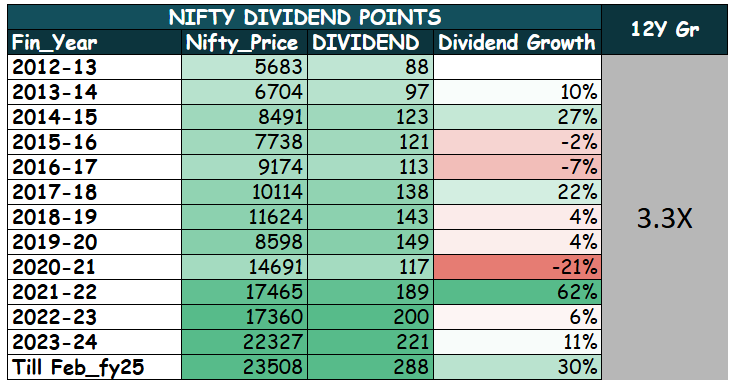
Growth of Nifty 50 dividends over the past 12 years, highlighting how long-term investors have benefited from consistent and increasing dividends.
Nifty 50 Dividend Analysis:
Consistent Dividend Growth:
Over the years, the Nifty 50 index has demonstrated consistent dividend payouts, reflecting the financial health and profitability of its constituent companies.
Dividends have grown substantially from 88 points in FY 2012-13 to an estimated 294 points in FY 2024-25, indicating a long-term trend of increasing passive income.
Remarkable Growth Phases:
2014-15 saw a strong 27% growth, indicating an era of increasing corporate profitability.
A record 62% growth in FY 2021-22 highlights recovery and resilience post-pandemic.
Challenges:
There have been minor declines in certain years, such as -21% in FY 2020-21, likely due to global disruptions like the COVID-19 pandemic. However, the subsequent strong recovery shows the robustness of the Nifty 50 companies.
Current Momentum:
Dividend growth for FY 2023-24 stood at 4X, and the current financial year (till November FY25) already shows an impressive 38% increase, specifically due to sharp increase in Profits last year, the dividends for last closing year are paid during this early financial year.
Long-term Wealth Potential:
The steady rise in dividends demonstrates the potential of the Nifty 50 for creating a reliable stream of passive income, which grows over time.
This makes it an attractive option for long-term investors focused on compounding wealth and securing passive income.
Investor Takeaway: The Nifty 50 index serves as an excellent choice for investors looking to combine capital appreciation with consistent and growing dividend income. By reinvesting dividends or utilizing them as passive income, investors can leverage this trend for long-term wealth generation.
Nifty Intrinsic Value as per current earnings:
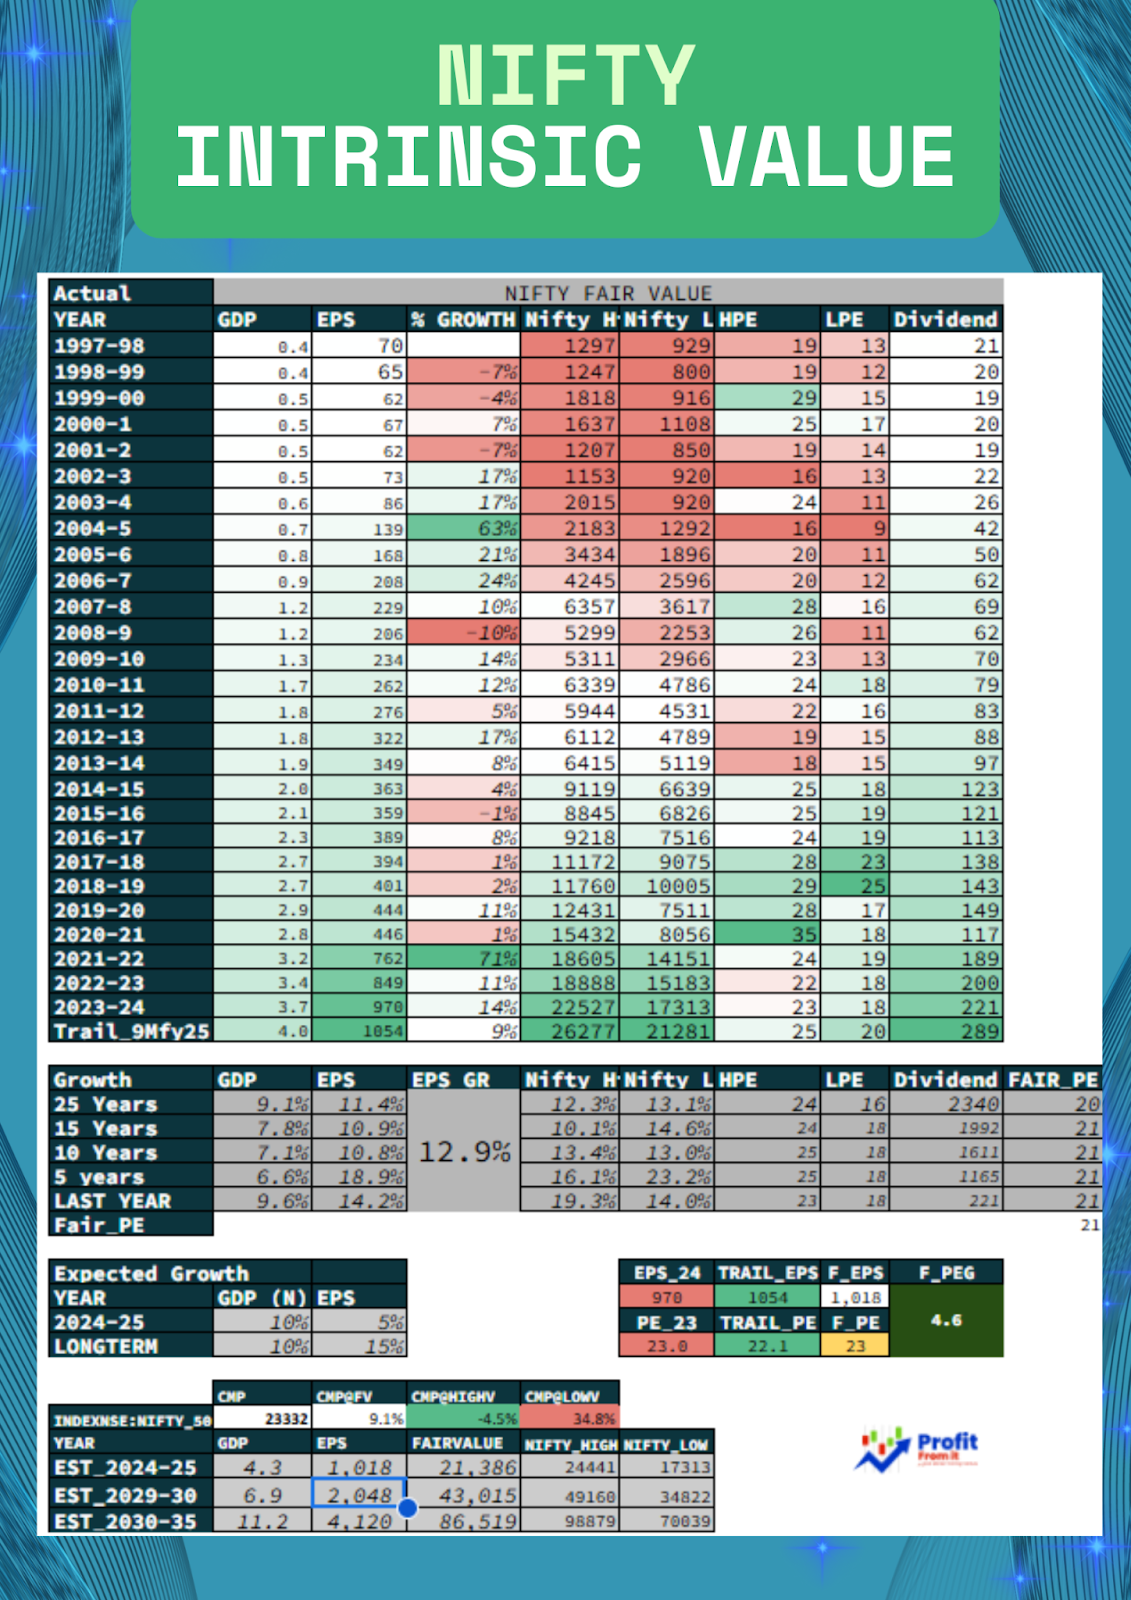
🔍 Key Highlights: Historical Data (1997–2024)
📈 EPS & Nifty Growth Trends
EPS Growth (1997–2024):
CAGR over 25 years: ~11.4%
EPS in 1997–98: ₹70 → 2023–24 EPS: ₹970
EPS has shown consistent long-term growth, despite short-term volatility (e.g., dips during 2008 crisis, 2020 pandemic).
Nifty Index Movement:
1997–98 Nifty High: 1297 → 2023–24 High: 22,527
Nifty's High and Low have steadily increased, reflecting growing investor confidence and economic expansion.
📊 PE Valuation Range (HPE & LPE)
Over the long term:
High PE (HPE) ranged: 19–29
Low PE (LPE) ranged: 11–21
Average Fair PE estimated: 21
🏦 Dividend Trends
Dividends per share have steadily increased:
₹21 (1997–98) → ₹289 (2023–24)
Indicates rising profitability and shareholder returns.
📌 Recent Year Insights
2023–24 EPS: ₹970
Nifty PE (Fair): 21
Fair Value Estimate: ₹20,364 (EPS × PE)
Actual High: ₹22,011 → Slightly above fair value (indicates slightly stretched valuation)
📅 Growth Trends (CAGR Analysis)
🟢 Key Insight: Nifty and EPS have consistently outpaced GDP, reflecting improved efficiency, formalization, and corporate profit growth.
📈 Future Projections: 2024–2035
⚙️ Assumptions
GDP (Current Price) Growth: 10%
EPS Growth: 15% annually
PE: ~21
🔮 Nifty Target Estimates
🔑 Insight: If assumptions hold, Nifty could potentially 4x in the next 10 years, supported by strong earnings growth.
🧮 Valuation Check (Current)
EPS FY24: ₹970
Trailing PE: 23.0 → Slightly above fair PE of 21
PEG Ratio: ~4.6 → Indicates overvaluation based on growth vs valuation
💡 Investor Takeaways
✅ Positives:
Strong long-term earnings growth (~11.4% CAGR)
Nifty has historically traded within a known PE band (18–24)
Dividend payouts increasing steadily
Projected earnings growth of 15% will drive index higher if sustained
⚠️ Risks/Cautions:
Current valuations are slightly above long-term fair PE → watch for corrections
Short-term EPS dips (e.g., in 2020) show susceptibility to macro shocks
High PEG ratio suggests premium valuation vs. growth potential
📌 Strategies for Investors:
SIP/Long-term investing remains favorable given the strong historical compounding and future potential
Rebalancing advisable if Nifty crosses upper valuation bands (PE >24)
Consider dividend growth stocks for added income and stability
NIFTY INCLUSIONS & EXCLUSIONS:
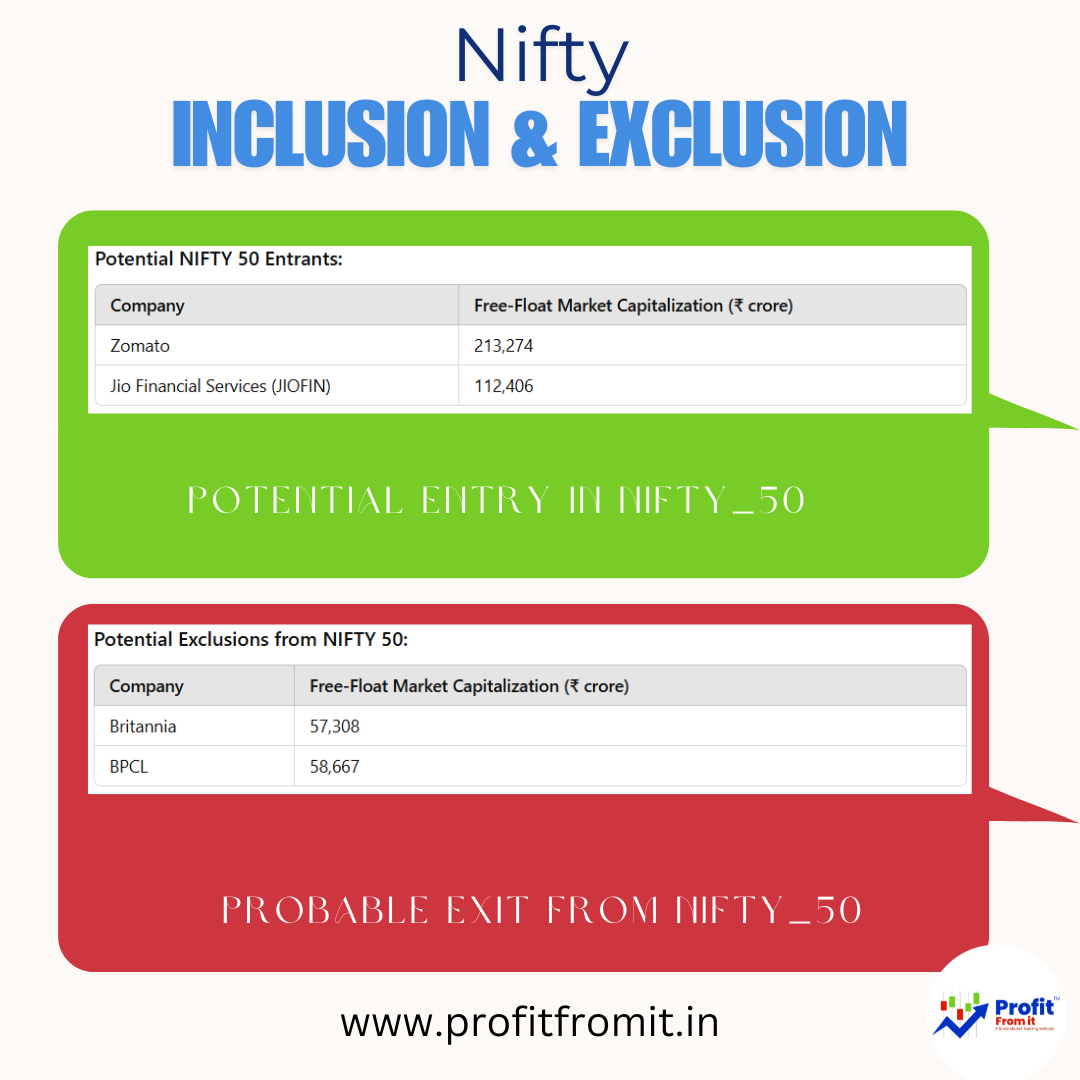
The NIFTY 50 index comprises 50 diversified stocks representing key sectors of the Indian economy. Inclusion and exclusion of companies in this index are primarily based on free-float market capitalization and liquidity criteria.
Eligibility Criteria for NIFTY 50 Inclusion:
1. Liquidity: The stock should have traded at an average impact cost of 0.50% or less during the last six months for 90% of the observations, for a basket size of ₹100 crore.
2. Listing History: A minimum listing history of one calendar month as of the cut-off date.
3. Derivatives Eligibility: The company must be allowed to trade in the Futures & Options (F&O) segment.
4. Free-Float Market Capitalization: The company's free-float market capitalization should be at least 1.5 times that of the smallest constituent in the NIFTY 50.
Note: The index is rebalanced semi-annually, with changes typically announced four weeks in advance.
Analysis:
- Zomato: With a free-float market capitalization of ₹213,274 crore, Zomato surpasses the threshold for inclusion. If it meets the liquidity and derivatives eligibility criteria, it stands a strong chance for inclusion.
- Jio Financial Services (JIOFIN): Holding a free-float market capitalization of ₹112,406 crore, JIOFIN also exceeds the required threshold. Its inclusion would depend on meeting other criteria, such as liquidity and F&O eligibility.
- Britannia and BPCL: Both companies have relatively lower free-float market capitalizations (₹57,308 crore and ₹58,667 crore, respectively). If their market capitalizations fall below the threshold or if there are better candidates for inclusion, they might face exclusion during the rebalancing.
In summary, Zomato and Jio Financial Services are strong candidates for inclusion in the NIFTY 50, provided they meet all eligibility criteria. Conversely, Britannia and BPCL could be at risk of exclusion if they no longer meet the necessary benchmarks.
Schedule Of Events

🔓 Unlock the Secrets to Wealth Creation: Join Us Live in Delhi - 5 Steps Towards Wealth!
Click the link to Book Your Seats Now: https://forms.gle/Z1AGnX7Xqrt9QqXX9

Book On “5 Steps Towards Wealth” - The Stock market way - has Launched after long wait.
https://www.profitfromit.in/course/TheStockMarketWay5StepsTowardsWealthaBook-59613
As per Sebi: Reports on Indices view does not need compliance regulation
Log in: www.profitfromit.in
YouTube: https://www.youtube.com/c/PIYUSHPATELprofitfromit
Facebook: www.facebook.com/profitfromit
