Coverage:
Indices view Nifty Yearly behavior
Broader Indices Yearly view
Picture for 2026.
Fundamental data
Events schedule: www.Profitfromit.in conducted events.
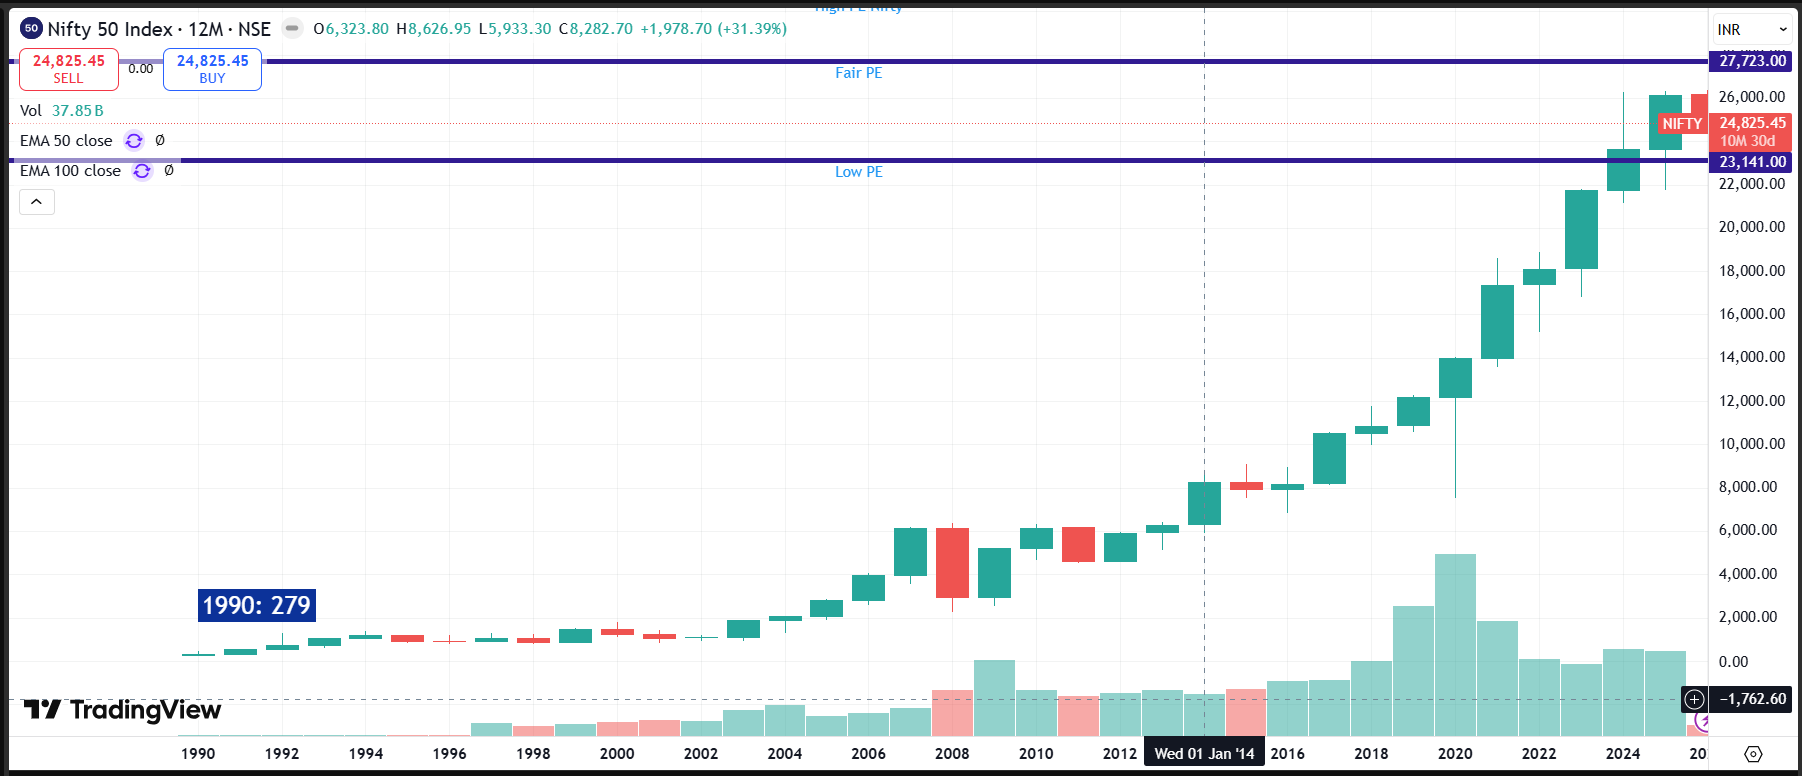
Indices View Nifty 2026:

What we discussed in 2024: Nifty was 21731:
After the higher high for the 8th year in a row, the selling pressure was seen from 26277 and we saw an inverted hammer type of candle last year suggesting correction. The most important level to track this year should be 21096 to 21317. We have already seen the Higher high for 8 years in a row and lower high for 4 years but closing last year was seen with profit booking. Nifty sustaining above 21317 can continue the rally we saw for the last many years towards 26236 or even 28826. The -ve trend in the current situation could again re-enter if & only if Nifty falls below 21317 else biases could be flat to +ve. As per the results till Q3fy25 we have already seen muted sales growth of 7.9% and Profit growth of just 5.5% which does not support a strong rally. The Rule should be simple: New buying can be done during any falls to benefit from the rally.
What happened in 2025: Nifty is 26130:
The mild recovery in Sales growth was seen post Q2fy26 at 7.3% but profit posted the strong growth of 16% due to lowering inflation and decreasing interest rates. Nifty this year made the higher high of 26326 but was not able to close above that, suggesting indecisiveness in the rally. Yes we saw the higher high for the 9th year in a row and 5th year of lower suggesting improving macro data but still indecisiveness by closing lower due to high world uncertain tariffs. Yes, we can say Nifty stood in the correction phase for 2025 as it was not able to travel in the untravelled territory. We saw the 3 Quarters of fall correcting 4533 points which is 17.3% damage and later on we saw the similar recovery of 100% fall in the same 3 Quarters. Here Microcap & smallcap were hammered near to 30%. Overall during the past 20 years we saw 13% CAGR return from Nifty v/s 7% by Dow Jones. During the 20th Century last 40 years world GDP grew by 8% while Indian GDP underperformed with the growth of just 6%. In the 21st Century we saw Indian GDP grow by 10% v/s World GDP growth of 5%. The 21st century is India’s time, and yes we can say India’s time has come. However 2025 was the year where India outperformed on macro economic activity and underperformed in Equity markets to the world. Such a divergence can give good opportunity to investors as now Indian markets came again near fair value which were trading high in respect to the world market.

What to expect in 2026: Nifty is 26130:
Considering the improvement in GDP growth, lowering inflations and interest rates, we have seen the impact in Sales and Profits. Sales growth improved even in 9Mfy26 due to staggering 12% growth in Q3fy26 while Profits were affected due to New Labour code which is a temporary set back. The most important level to track for the whole year of 2026 is 21744. We may see strong support of 23141 to 21744 during this whole year considering we make the higher low even in 2026 which is 5th year in a row. Nifty’s ability to take the support of 23141 can make the higher high for the 10 Year in a row which will be the historic moment for India. We may see Nifty making the higher high of 27723 which will be the 1st target for this year. The rally could be seen in the continuity towards 29315 in such a case. Hence, the level to track this year should be the lower range of 23141 to 21744 where strong buying can be done using the cash we kept keeping the targets of 27723 to 29315 during the year 2026. The Rule should be simple: New buying can be done during any falls to benefit during the rally.
Nifty 2026 Pivot Points: 24733
Resistance: 27723, 229315, 32305
Support: 23141, 20151, 18559
+ve broader indices for coming Year: Nifty_Bank, Nifty_Auto, Fin_Services, Metal, Value_20, PSUBank, Pvtbank
-ve broader indices for the coming Year: Media
Crude: 57.42

Crude may face strong resistance moving above 81 as this is the 3rd year in a row with lower high lower low and the lower close. We may see the 5year low of 48.
Fundamentals: as per current announced earnings and not as per Forwarding earnings.
Nifty Intrinsic Value as per current earnings

Dividend Points

Schedule Of Events

4 Months Fundamental & Technical Analysis Practical Workshop -August Batch
https://www.profitfromit.in/course/4MonthsFundamentalTechnicalAnalysisPracticalWorksh-43666

Book On “5 Steps Towards Wealth” - The Stock market way - has Launched after a long wait.
https://www.profitfromit.in/course/TheStockMarketWay5StepsTowardsWealthaBook-59613
As per Sebi: Reports on Indices view does not need compliance regulation
Log in: www.profitfromit.in
YouTube: https://www.youtube.com/c/PIYUSHPATELprofitfromit
Facebook: www.facebook.com/profitfromit
Disclosure: Do not initiate before consulting your advisor as the writer may have the position in the above index.

SEBI (RESEARCH ANALYSTS) REGULATIONS, 2014
What are all the communications excluded from the definition of the research report?
"Research report” does not include the following communications:-
i. comments on general trends in the securities market
ii. discussions on the broad-based indices; iii. commentaries on economic, political or market conditions; iv. periodic reports or other communications prepared for unitholders of Mutual Fund or Alternative Investment Fund or clients of Portfolio Managers and Investment Advisers;
v. internal communications that are not given to current or prospective clients;
vi. communications that constitute offer documents or prospectus that are circulated as per regulations made by SEBI vii. statistical summaries of financial data of the companies viii. technical analyses relating to the demand and supply in a sector or index ix. any other communication which SEBI may specify from time to time [Ref. Regulation 2(1)(w)]
Making buy/sell/hold recommendation on individual stocks based on the technical analysis is not exempted under the purview of the RA Regulations. However, technical analyses relating to the demand and supply for a particular sector or index is exempted from the purview of the RA Regulations. [Ref. Regulation 2(1)(w)]
So no disclosures required in Indices View. Still, at some places, we have given buying signals for index so disclosures are given at that places.

