Analysis of the IIP data for November 2024:
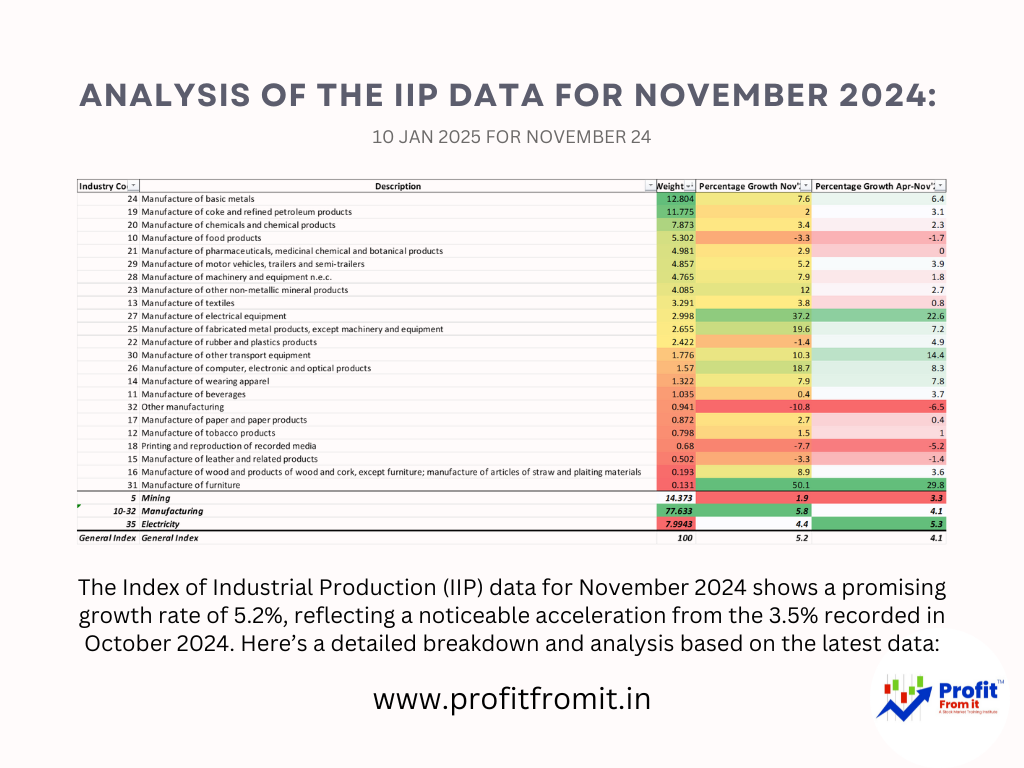
The Index of Industrial Production (IIP) data for November 2024 shows a promising growth rate of 5.2%, reflecting a noticeable acceleration from the 3.5% recorded in October 2024. Here’s a detailed breakdown and analysis based on the latest data:
Key Highlights and Insights:
Overall Growth: 📈 The IIP stood at 148.4 in November 2024, compared to 141.1 in November 2023, marking a growth of 5.2% which is better sequential previous quarter as well as if compared with last year. Yes, Improvements is visible in Q3.
Sectoral Performance:
Mining: ⛏️ Showed moderate growth at 1.9%. Underperformance.
Manufacturing: 🏭 Recorded a stronger growth of 5.8%, driven by significant contributions from specific sub-sectors. Good improvements are seen.
Electricity: ⚡ Increased by 4.4%.
Strongest and Weakest Growth Items:
Strongest Growth:
Manufacture of Electrical Equipment: 💡 Saw a substantial increase, particularly in items like electric heaters and transformers, recording a growth of 37.2%.
Manufacture of computer, electronic and optical products saw a substantial increase by 18.7% in November. Strong growth expected further.
Manufacture of Furniture: 🪑 Exhibited the highest growth at 50.1%, with significant demand for furniture products.
Manufacture of wearing apparel: Growth of 7.9% is seen which is good v/s what we saw last year.
Manufacturing of Chemical Products which was negative last year has started showing green shots: Growth of 3.4% is not extraordinary but is better that -ve last year. Further improvements expected.
Manufacture of pharmaceuticals: On Improvement Phase at 2.9% v/s muted last year.
Weakest Growth:
Manufacture of leather and related products (for eg. Footwears): 🔻 Experienced the most significant decline, with a drop of -3.3% which was already in negative for full year. No improvements seen here.
Use-Based Growth:
Capital Goods: 🏗️ Grew by 9.0%, indicating a strong investment cycle and potential future production increases.
Infrastructure/Construction Goods: 🚧 Witnessed a significant growth of 10.0%, reflecting robust activity in construction and infrastructure development.
Consumer Durables: 🛍️ Had a notable growth of 13.1%, suggesting increased consumer spending and confidence.
Implications for Stock Market Investing:
Sectoral Opportunities: 📊 Growth in sectors like electrical equipment, furniture, and capital goods indicates strong business momentum, which could translate into better stock performance for companies in these sectors. This could be the stocks making new lifetime high in good market.
Risk Management: ⚠️ Areas showing declines, such as 'Leather Products,' may pose higher risks, suggesting a cautious approach to investments in these areas. This are the companies that can make new 52 week low during week markets.
How Investors Can Benefit from Monthly IIP Data:
Timely Adjustments: ⏱️ Regular updates on IIP allow investors to adjust their portfolios based on the latest performance trends across sectors, helping to optimize returns and manage risks.
Identifying Trends: 🔍 By analyzing month-on-month changes, investors can spot emerging trends early, enabling them to invest in sectors before they become widely recognized for their growth.
Sectoral Allocation: 📑 Understanding which sectors are expanding or contracting can guide investors in allocating their resources more effectively, aligning with growth sectors and avoiding those in decline.
Stay Advance: 📑 The IIP data are advance to GDP and even Results and the last impact is seen on Charts.
In summary, the IIP data provides valuable insights for investors, highlighting growth sectors that might yield better returns and identifying areas of concern that may require a strategic review of investment allocations.

