📢 India's GDP Report - Q3 FY 2024-25 & Annual Estimates 📊
🚀 Key Insights & GDP Trends
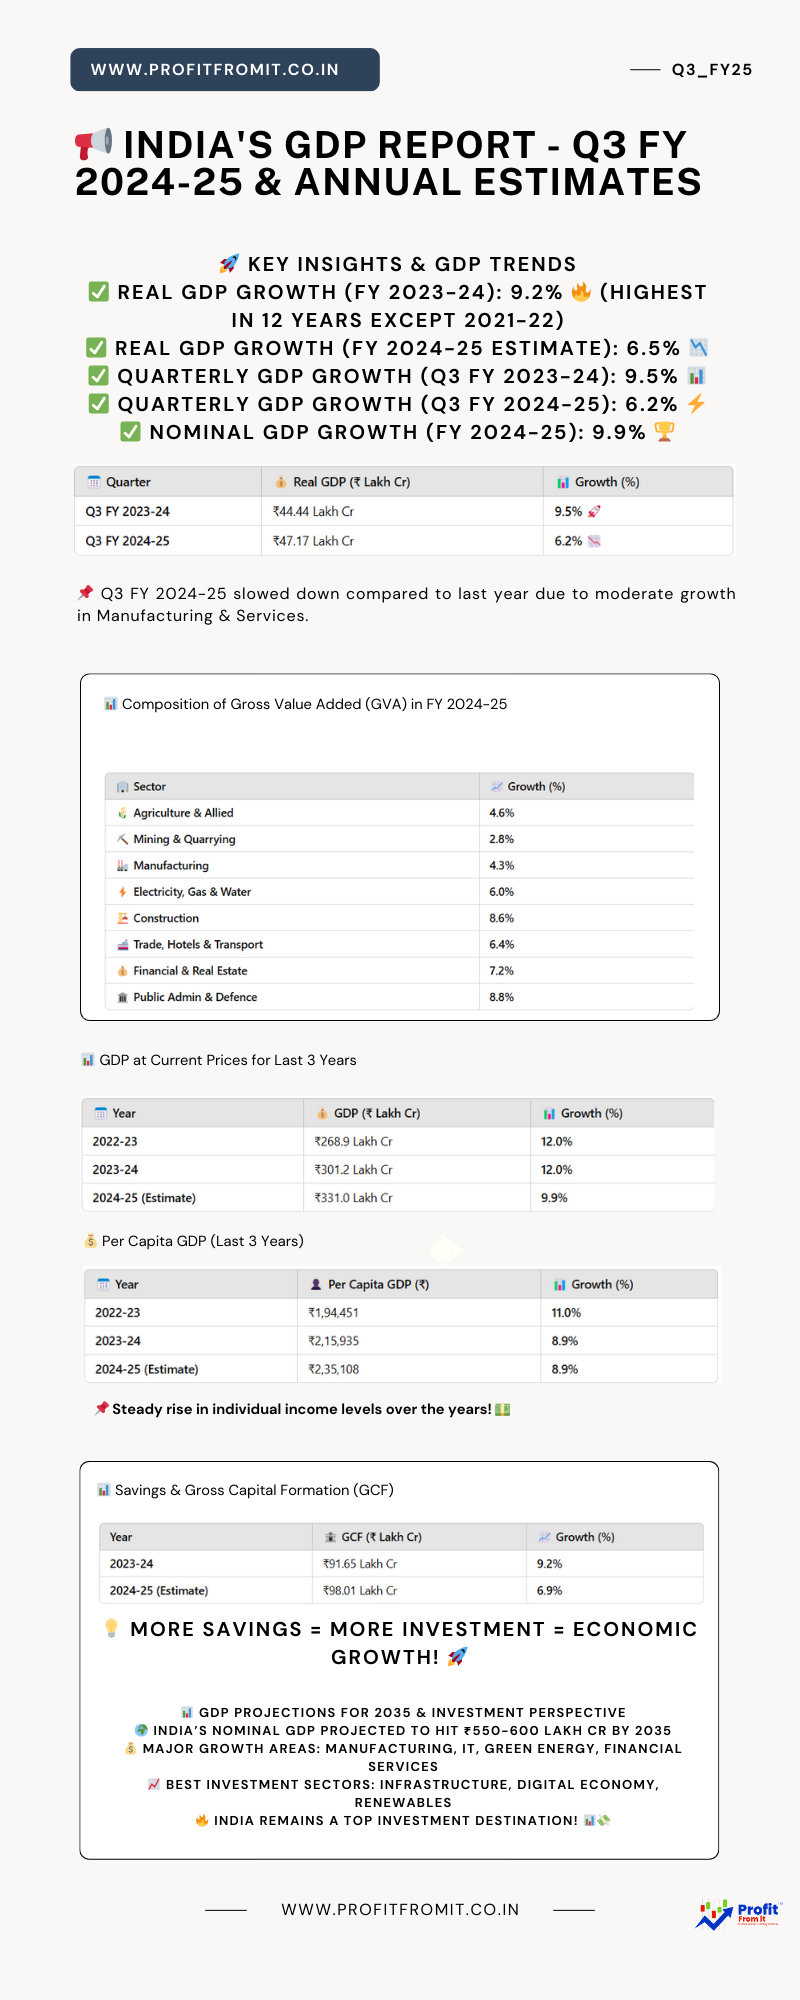
✅ Real GDP Growth (FY 2023-24): 9.2% 🔥 (Highest in 12 years except 2021-22)
✅ Real GDP Growth (FY 2024-25 Estimate): 6.5% 📉
✅ Quarterly GDP Growth (Q3 FY 2023-24): 9.5% 📊
✅ Quarterly GDP Growth (Q3 FY 2024-25): 6.2% ⚡
✅ Nominal GDP Growth (FY 2024-25): 9.9% 🏆
✅ Historical Success of Kumbh Mela would help boost Q4 GDP 🏆
📌 India remains Fastest Growing economy as World estimated to grow at 3.2%
If We compare with Major Economies: US 2.8%, China: 4.8%, Japan: 0.3% and Germany: 0%,
If We compare with Emerging Economies: Brazil 3%, Russia: 3.6%, South Africa: 1.1% and BanglaDesh 4.5% and China we have already taken in Major Economies.
India is incomparable in Growth either with Major or even with growing economies.
📈 Annual GDP Growth Estimate Trends (YoY)
📅 2022-23: 7.6% 📊
📅 2023-24: 9.2% 🚀
📅 2024-25 (Estimate): 6.5% 📉
🛠️ Top Contributors (2023-24):
🏭 Manufacturing: 12.3% 📦
🏗️ Construction: 10.4% 🏢
💰 Financial & Real Estate: 10.3% 🏦
📅 Quarterly GDP Growth Trends
📌 Q3 FY 2024-25 slowed down compared to last year due to moderate growth in Manufacturing & Services.
🏭 Sectoral Composition of GDP (Q3 2024-25)
📌 Primary (Agriculture, Mining, etc.): 19.5% 🌾
📌 Secondary (Manufacturing, Utilities, Construction): 28.5% 🏗️
📌 Tertiary (Services, Finance, Trade, Public Services): 52.0% 💼
🚀 Fastest Growing Sectors (Q3 2024-25)
🏗️ Construction: 8.6% 🏢
🏦 Financial & Professional Services: 7.2% 💰
🚢 Trade, Hotels, Transport & Broadcasting: 6.4% 🚀
📊 Composition of Gross Value Added (GVA) in FY 2024-25
📊 Sector-Wise GDP Growth in Q3 2024-25
🚀 Strong Sectors:
🏗️ Construction (+7.0%)
💼 Financial & Professional Services (+7.2%)
🚢 Trade & Transport (+6.7%)
⚠️ Weakest Sectors:
⛏️ Mining & Quarrying (+2.8%)
🏭 Manufacturing (+4.3%)
📊 Major Data Sources for GDP Compilation
🔹 Industrial Production (IIP) 📦
🔹 Agricultural Production 🌾
🔹 Cement, Steel, and Coal Data ⛏️
🔹 Railways & Aviation Traffic 🚄✈️
🔹 Bank Deposits & Credit 🏦
🔹 GST Collections 💰
💰 Private Final Consumption Expenditure (PFCE)
🔹 PFCE Share in GDP (FY 2024-25): 56.7% 📊
🔹 Growth in PFCE: 7.6% 🚀
💡 Why PFCE is Important?
✅ Drives Economic Growth
✅ Reflects Consumer Demand
✅ Key Indicator of Household Spending
📦 Import & Export Growth (Q3 2024-25 vs Q3 2023-24)
📦 Exports: ₹10.42 Lakh Cr (+10.4%) 🚢
📥 Imports: ₹10.53 Lakh Cr (-1.1%) 📉
🚀 Exports Growing Faster, while Imports Declined, improving trade balance.
📊 GDP at Current Prices for Last 3 Years
💰 Per Capita GDP (Last 3 Years)
📌 Steady rise in individual income levels over the years! 💵
🚀 Fastest Growing Industry in FY 2024-25
🏗️ Construction Sector (+8.6%) 🏢
💼 Financial, Real Estate & Professional Services (+7.2%) 🏦
📊 Fastest & Weakest Growing Indicators
🚀 Fastest Growth:
🏗️ Construction (8.6%)
💰 Financial Services (7.2%)
⚠️ Slowest Growth:
⛏️ Mining (2.8%)
🏭 Manufacturing (4.3%)
📊 Savings & Gross Capital Formation (GCF)
💡 More savings = More investment = Economic growth! 🚀
📊 GDP Projections for 2035 & Investment Perspective
🌍 India’s Nominal GDP projected to hit ₹550-600 Lakh Cr by 2035
💰 Major Growth Areas: Manufacturing, IT, Green Energy, Financial Services
📈 Best Investment Sectors: Infrastructure, Digital Economy, Renewables
🔥 India remains a top investment destination! 📊💸
🔥 India To enter into TOP 10 FDI destinations till 2035 from current ranking of 18th 📊💸
Suno Gaur Se Duniya Walo, Buri nazar na hum pe dalo, Chahe jitna jor laga do, sabse aage honge Hindustani.
🔁 Share this for more economic insights!
📢 Follow for more updates! 🚀📊💰

