Based on the Q3 FY25 GDP data Main Indicator Published, here are key insights and highlights that could be useful for investors analyzing India's economic growth across different sectors:
1. Industrial & Manufacturing Growth - Slower but Stable (Year on Year slowdown is visible, Improvement was seen Q-o-Q)
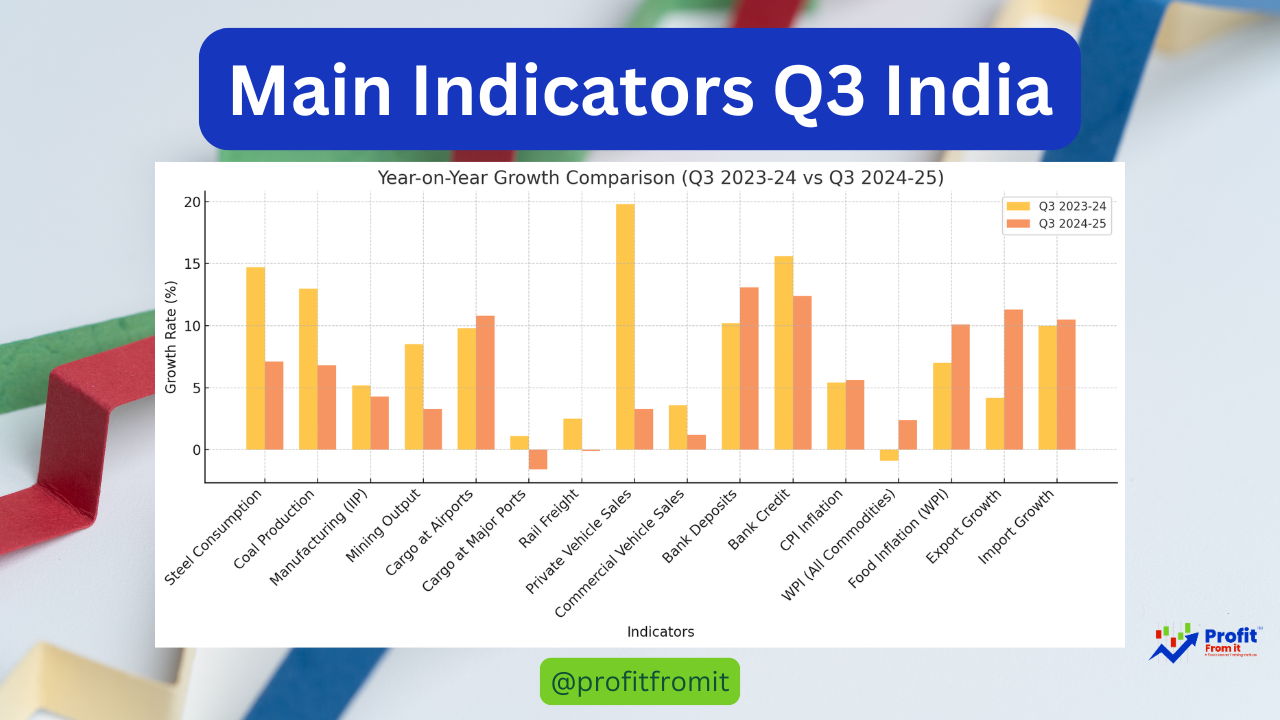
Steel Consumption: Growth has slowed to 7.1% in Q3 FY25 from 14.7% in Q3 FY24, indicating reduced demand in construction and infrastructure projects. However, it remains positive, showing continued activity in core industries.
Coal Production: Growth reduced from 13.0% (Q3 FY24) to 6.8% (Q3 FY25), reflecting a potential slowdown in energy-intensive industries.
Manufacturing (IIP): Slowed down from 5.2% to 4.3%, which suggests moderation in industrial production.
Mining Output: Growth dropped from 8.5% to 3.3%, possibly due to weaker demand or policy changes affecting mining activities.
Investment Implication: Industrial growth is moderating but still expanding. Investors should focus on sectors benefiting from government infrastructure spending rather than cyclical industrial growth.
2. Transport & Logistics – Mixed Performance (Year on Year slowdown is visible, Improvement was seen Q-o-Q)
Cargo at Airports: Slight improvement from 9.8% to 10.8%, indicating continued growth in air freight and e-commerce-driven logistics.
Cargo at Major Ports: Slowed down from 1.1% to -1.6%, showing weakening trade activity.
Railways (Net Tonne Km): Declined from 2.5% to -0.1%, suggesting lower freight movement.
Investment Implication: Slowing seaport and rail freight suggest weaker global trade, impacting logistics firms and exports. However, air freight remains resilient, benefiting companies involved in express logistics and e-commerce.
3. Consumer & Retail Demand - Positive Signs (Year on Year slowdown is visible, Improvement was seen Q-o-Q)
Sales of Private Vehicles: Growth slowed from 19.8% to 3.3%, indicating weakening consumer sentiment or supply chain constraints.
Sales of Commercial Vehicles: Dropped from 3.6% to 1.2%, reflecting a slowdown in business investments in transport infrastructure.
Aggregate Bank Deposits: Rose from 10.2% to 13.1%, indicating higher savings, possibly due to cautious consumer sentiment.
Aggregate Bank Credit: Growth fell from 15.6% to 12.4%, suggesting moderate lending activity.
Investment Implication: Consumer demand is still present but less robust than before. Investors should focus on defensive sectors like FMCG and essential consumer goods rather than discretionary spending sectors like luxury automobiles.
4. Inflation & Pricing Trends - Inflation Cooling Down (Year on Year increased Inflation is visible, but Improvement was seen Q-o-Q)
CPI General Index: Slightly increased from 5.4% to 5.6%, suggesting stable inflation.
WPI (All Commodities): Turned positive at 2.4% from -0.9%, indicating rising input costs, which could pressure margins for manufacturers.
Food Inflation (WPI): Increased from 7.0% to 10.1%, which could lead to higher retail inflation in the coming months.
Investment Implication: Inflation is still within control but rising food prices could impact consumer spending. Investors should be cautious about consumer staple companies that may see margin pressures.
5. Government Spending & Fiscal Indicators
Revenue Expenditure (Interest Payments & Subsidies): Growth rose from 4.5% to 5.6%, indicating continued government support.
Export Growth: Increased from 4.2% to 11.3%, suggesting stronger external demand.
Import Growth: Increased from 10.0% to 10.5%, which shows resilience in domestic consumption.
Investment Implication: Strong export performance benefits IT services, pharma, and high-value manufacturing. Government spending will continue to support infrastructure and social programs, benefiting companies in these sectors.
Final Takeaways for Investors: Slowdown is visible in Q1 , Q2 and Q3 Results which made the equity market in corrections, but we saw improvement in M-o-M. Can assume improvements further.
✅ Sectors to Watch:
Infrastructure & Construction: Still strong despite slower steel consumption.
Air Cargo & Logistics: Benefiting from e-commerce and supply chain efficiency.
Export-Oriented Sectors: IT services, pharmaceuticals, and specialty manufacturing.
Banking & Financials: Deposits rising, but credit growth needs close monitoring.
⚠️ Sectors Facing Risks:
Consumer Discretionary (Auto, Luxury Goods): Private vehicle sales slowing down.
Metals & Mining: Slower growth in coal, steel, and minerals may impact profits.
Retailers & FMCG: Rising food inflation could squeeze consumer budgets.

