๐Ÿ“Š The Inflation Rebound: Contextualizing the November 2025 CPI Data | Profit From It
profitfromit1@gmail.com
Whatsapp

๐Ÿ“Š The Inflation Rebound: Contextualizing the November 2025 CPI Data

Lesson 44/50 | Study Time: 10 Min
๐Ÿ“Š The Inflation Rebound: Contextualizing the November 2025 CPI Data


๐Ÿ“Š The Inflation Rebound: Contextualizing the November 2025 CPI Data

Topic: Analyzing the November 2025 CPI Data: A Reversal of the Recent Trough and Its Implications for Investors

Humor Hook: Don't panic! It's just a little bit of inflation... like finding one extra raisin in your cookie. We'll show you where that raisin came from and what it means for your portfolio.

The latest Consumer Price Index (CPI) numbers for November 2025 show a calculated rebound in overall inflation, following the significant drop seen in the preceding months. For the astute investor, this signals a need to re-evaluate sectors and strategies, specifically asking: Is this the beginning of a new inflationary cycle, or merely a statistical correction?

Let's dive into the core data from the National Statistics Office (NSO) press release and translate it into actionable investment knowledge.
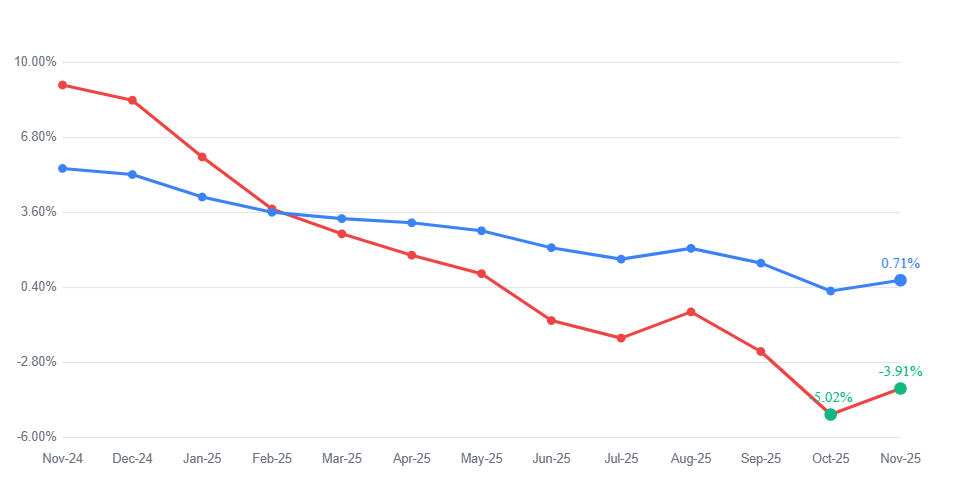
๐Ÿ“ˆ Key Inflation Insights: Headline & Food Inflation - The Rebound Effect

The most crucial takeaway is the upward shift in both key inflation metrics, pulling away from the recent lows:

Metric

October 2025 (Final)

November 2025 (Provisional)

Change

Contextual Insight for Investors

Headline CPI (Combined)

0.25%

0.71% 

+46 bps 

This is a rebound from the 0.25% trough in October 2025 , breaking the steep decline from 5.48% in Nov-24.

Food CFPI (Combined)

-5.02% 

-3.91% 

+111 bps 

Deflation in food is narrowing significantly, indicating an end to the deepest food deflation experienced in recent months.


  • Headline Inflation Trend: The year-on-year CPI (Combined) inflation rose by 46 basis points (bps), climbing from 0.25% in October to 0.71% in November 2025. When viewed against the multi-month decline (from 9.04% in Nov-24 down to 0.25% in Oct-25), this change appears to be a natural reversal of the recent sharp moderation.

  • Food Inflation Trend: The Consumer Food Price Index (CFPI) remains in deflationary territory (-3.91% year-on-year) but saw a dramatic increase of 111 bps compared to October's -5.02%. This significant narrowing of deflation is the primary catalyst driving the headline CPI increase.

๐Ÿฅ• What Drove the Rebound? (Core Analysis)

The NSO press release explicitly attributes the increase in headline and food inflation to the rise in inflation of key food items and fuel: Vegetables, Egg, Meat and fish, Spices and Fuel and light.

  • Vegetables: While still in massive deflation (-22.20% combined), this rate is narrowing, pulling the CFPI upward.

  • Rural vs. Urban Disparity: The rural sector's CPI shifted from deflation (-0.25% in Oct-25) to positive inflation (0.10% in Nov-25) , indicating that cost pressures are returning to the rural economy.


๐ŸŽ Major Drivers & Key Item Inflation

(Rest of the original analysis, with updated citations for clarity.)

1. Description with Highest Inflation (Y-o-Y, Combined)

Item Description

Weights

Inflation Rate (%)

Key Insight for Investors

Silver

0.11% 

65.52%

High inflation in precious metals indicates strong store-of-value demand.

Coconut oil

0.08%

72.56%

Exceptionally high, niche commodity price volatility.

Gold

1.08% 

58.52% 

Strong inflation hedge demand, despite a relatively small weight.

Oils and fats (Group)

3.56%

7.87%

High input costs, beneficial for specific edible oil producers.

Fruits

2.89% 

6.87%

Showing persistent price pressure.

2. Descriptions with Lowest Inflation (Deflation)

Item Description

Weights

Inflation Rate (%)

Key Insight for Investors

Onion

0.64%

-55.38%

Extreme deflation (price crash) in a highly volatile vegetable.

Tomato

0.57% 

-12.76%

Deflation is narrowing sharply from -42.96% in October.

Vegetables (Group)

6.04%

-22.20%

Overall deflation is narrowing, indicating cost pressures are re-emerging

Pulses and products (Group)

2.38%

-15.86%

Continued deflation, which is helping temper overall food prices.

3. Most Weighted Items/Groups

The CPI basket's biggest influences are:

  • Food and beverages: 45.86% weight 

  • Miscellaneous: 28.32% weight (includes Health, Transport, Education)

  • Cereals and products: 9.67% weight 

๐ŸŒŽ State-Level Inflation: Highs and Lows

For localized investment decisions, analyzing regional inflation is key.

Rank

State/UT

Combined Inflation (%) (Nov-25)

Rural (%)

Urban (%)

Highest

Kerala

8.27%

9.34%

6.33%

2nd Highest

Karnataka

2.64%

2.40%

2.88%

Lowest

Bihar

-1.67%

-1.83%

-0.44%

2nd Lowest

Assam

-0.90%

-1.30%

0.66%

Kerala has the highest inflation, driven significantly by its rural sector (9.34%). Conversely, states like Bihar and Assam are experiencing deflation.

๐Ÿ’ก Impact on Stock Market Investing & Related Sectors

As an investor, the primary focus is translating this economic data into stock market strategy.

Inflation Signal

Sector Impact (Fundamental Analysis)

Investment Strategy

Food Deflation Rebound (+111 bps) 

Rising costs for Vegetables and Eggs will affect discretionary income. Positive for Agri-commodities/FMCG with strong pricing power.

Buy: Quality FMCG (staples) with high market share. Avoid/Hold: QSR/Hospitality with weak pricing power.

Fuel & Light Inflation (2.32% Combined) 

Marginal increase in Fuel & light inflation. Affects transport costs across all industries (logistics, manufacturing).

Monitor: Logistics/Transport companies for margin pressure. Buy: Companies that hedge fuel costs effectively.

High Health Inflation (3.60% Combined) 

Health expenses continue to rise steadily.

Buy: Quality Healthcare/Pharma stocks with strong R&D pipelines, which are better able to pass on price increases.

Urban vs. Rural Divergence (Urban CPI 1.40% vs. Rural 0.10%) 

Urban demand appears more robust than rural demand, where inflation is just barely positive.

Focus: Companies generating significant revenue from urban centers. Rural consumption demand may still lag.

Precious Metals Surge (Gold 58.52%, Silver 65.52%) 

High inflation in metals signals investors' flight to safety and a hedge against global uncertainty.

Buy: Metal/Mining stocks, especially those in gold and silver, as inflation hedges.

โœ… Conclusion: An Expected Correction, But Watch Food

The November 2025 CPI data is best viewed as a correction or rebound from the exceptionally low inflation levels seen in October, driven primarily by the narrowing of food deflation. The rise from 0.25% to 0.71% is less concerning than the 111 bps jump in food prices, which signals that the steep discounts on vegetables and pulses are ending.

Investors should pivot their strategies to account for the re-emergence of cost pressures in the food basket, favoring companies with durable pricing power, and maintaining exposure to inflation-hedging assets like precious metals.

๐Ÿ“œ Disclaimer

This analysis is based solely on the official press release of the National Statistics Office (NSO) and is for informational purposes only. It is not investment advice. Stock market investing involves risk. Always conduct your own analysis before making any investment decision.


Piyush Patel

Piyush Patel

Product Designer
4.83
Faithful User
Expert Vendor
Golden Classes
King Seller
Fantastic Support
Loyal Writer
Profile

Class Sessions

1- World Economic Outlook Projections 2- SUMMARY OF UNION BUDGET 2022-23 3- Analysis of the IIP data for November 2024: 4- Consumer Price Index (CPI) for December 2024 5- World Economic Outlook Update: January 2025 Update 6- "Investing in Indiaโ€™s Future: What Economic Survey 2024-25 Reveals" ๐ŸŒ๐Ÿ’ต 7- Summary of Union Budget 2025-26 8- ๐Ÿ“Š RBI Repo Rate Trends & Nifty 50: A 15-Year Market Impact Analysis 9- Inflation, Liquidity, and Market Moves: RBIโ€™s Playbook for 2025: 10- ๐Ÿ“Š Inflation Insights & Stock Market Impact โ€“ January 2025 CPI Report ๐Ÿ“‰ 11- Income Tax Bill 2025: In The View of Potential long-term impacts for investors in India: 12- India's Labour Market (PLFS: Oct - Dec 2024) 13- India & Qatar: A $10 Billion Investment Game-Changer for 2030! 14- ๐Ÿ”ฅ Investment Insights from WEF Global Cybersecurity Outlook 2025 ๐Ÿ”ฅ 15- Analysis of Foreign Direct Investment (FDI) IN INDIA 16- ๐Ÿ“ข India's GDP Report - Q3 FY 2024-25 & Annual Estimates ๐Ÿ“Š 17- ๐Ÿ“Š GST Collection Growth again on uptick in February 2025 after slow down post Octo_24. โ€“ ๐Ÿš€ 18- Q3 FY25 GDP data Main Indicator Published 19- India's Economic and Demographic Trend Analysis 20- ๐Ÿš€ IIP Growth Analysis - January 2025: Insights for Investors ๐Ÿ“ˆ 21- India's Inflation Hits an 8-Month Low in February: What It Means for Your Investments 22- ๐Ÿ“Š India's Household Savings Trends & 2035 Forecast 23- Unleashing Potential: Education as a Catalyst for Economic Growth and Equity in India 24- ๐Ÿงญ New Fin Year 2026 Market Brief: Profit Rebounds, Debt Warnings, and a New Gold Rush 25- ๐ŸŒ Navigating Indiaโ€™s Global Trade Winds: Opportunities & Risks in 2025 26- ๐Ÿ“ฐ RBIโ€™s April 2025 MPC Policy: A Growth-Friendly Pivot โ€“ What Investors Should Know 27- ๐Ÿ’ก IIP Insights: What India's Feb 2025 Growth Means for Your Portfolio 28- Indiaโ€“UK Free Trade Agreement: A Transformative Leap for Indian Investors 29- ๐Ÿงญ Viksit Bharat @2047: Key Insights from the 10th NITI Aayog Governing Council Meeting 30- ๐Ÿ“˜ Indiaโ€™s IIP April 2025 Report: Capital Goods Lead 20% Growth | Sectors & Stocks to Watch 31- ๐Ÿ‡ฎ๐Ÿ‡ณ India Q4 FY25 GDP Report: Sectoral Trends, Growth Outlook & Stock Market Action Plan 32- ๐Ÿ‡ฎ๐Ÿ‡ณ Indiaโ€™s Poverty Reduction: Key Highlights & Investment Insights (2025) 33- ๐Ÿ“Š Indiaโ€™s Inflation Update โ€“ May 2025 34- RBI June 2025 Economic Report: Key Insights and Investment Opportunities for Indian Investors 35- May 2025 IIP growth slows to 1.2%. Manufacturing up 2.6%, electricity down 5.8%. 36- ๐Ÿ… National Sports Policy 2025: Indiaโ€™s Next Trillion-Rupee Megaplay 37- ### ๐ŸŒ **Global Economic Landscape: Snapshot and Trajectory** 38- World Economic Outlook July 2025 | Global Growth, Inflation & Investment Insights 39- ๐Ÿ“‰ CPI July 2025 Falls to 1.55% โ€“ Lowest Since 2017 | Food Inflation Turns Negative 40- India GDP Q1 FY2025-26 Report โ€“ Key Insights & Investor Takeaways 41- ๐Ÿ“Š Indiaโ€™s Inflation Snapshot โ€“ August 2025 42- Indiaโ€™s IIP โ€“ August 2025: โ€œSteel Strong, Staples Softโ€ 43- Rate Cut, Higher Growth, and Lower Inflation โ€“ What Does it Mean for Your Portfolio? 44- ๐Ÿ“Š The Inflation Rebound: Contextualizing the November 2025 CPI Data 45- ๐Ÿ“ˆ IIP Hits a 2-Year High: Is Your Portfolio Ready for the "November Knockout"? 46- Indiaโ€™s GDP Just Got a "Software Update": What the 2022-23 Base Year Reset Means for Your Portfolio 47- Investment Report: Country - India 48- Indiaโ€™s New IIP Revolution: What the 2022โ€“23 Base Revision Means for Industry & Investors 49- Anchor in the Drift: Deciphering the RBIโ€™s Strategic Neutrality Amidst Global Volatility 50- The Structural Pivot: Why Indiaโ€™s Leap to 7.7% GDP Represents a New Economic Paradigm
๐Ÿ’ฌ Chat with us!
Logo

Join & Start Learning Today

Already registered? Login here

โœ“

Start Profiting Now!

Welcome, there!
Your account is active. Enjoy full access.

Redirecting