📊 HDFC Asset Management Company (HDFC AMC) – Long-Term Investment Outlook
🏦 Company Overview
HDFC AMC, part of the HDFC Group, is one of India’s leading asset management companies, managing a wide range of mutual funds across equity, debt, and hybrid categories. Since receiving SEBI approval in 2000, the company has consistently grown its Assets Under Management (AUM) and maintained industry-leading profitability.
🌏 Industry Overview
The Indian asset management industry is poised for robust growth driven by:
Rising retail participation in equities & mutual funds 📈
Increased SIP inflows and financialisation of savings 💰
Strong regulatory framework and investor awareness campaigns
Penetration in Tier-2/3 cities and digital distribution channels 📲
India’s mutual fund industry AUM is expected to grow at ~15% CAGR over the next decade, with equity-oriented funds gaining higher share.
HDFCAMC: Fairvalue:
📈 Historical Growth – AUM, Sales, and Profits
🚀 AUM Growth: 165,619 Cr (FY16) → 8,28,600 Cr (FY26 Trailing)
💹 Profitability: Maintains one of the highest margins in the industry.
📊 Valuation History – PE & PBV Ranges
Price-to-Earnings (PE)
Price-to-Book Value (PBV)
📌 Insight: Valuations are currently near the upper historical band, reflecting premium market positioning.
📅 Q1 FY26 Performance Snapshot
💡 Revenue growth remains strong with minimal cost increases, maintaining superior margins.
🔍 Cost Structure – Q1 FY26
📈 FY26 and Long-Term Estimates
💰 Valuation Ranges (PE & PBV Based)
📌 Current Price: ₹5,586 – Near mid-range of FY26 valuations.
📦 Portfolio Allocation View
⚖️ Allocation reflects premium business with stable growth, but high valuations.
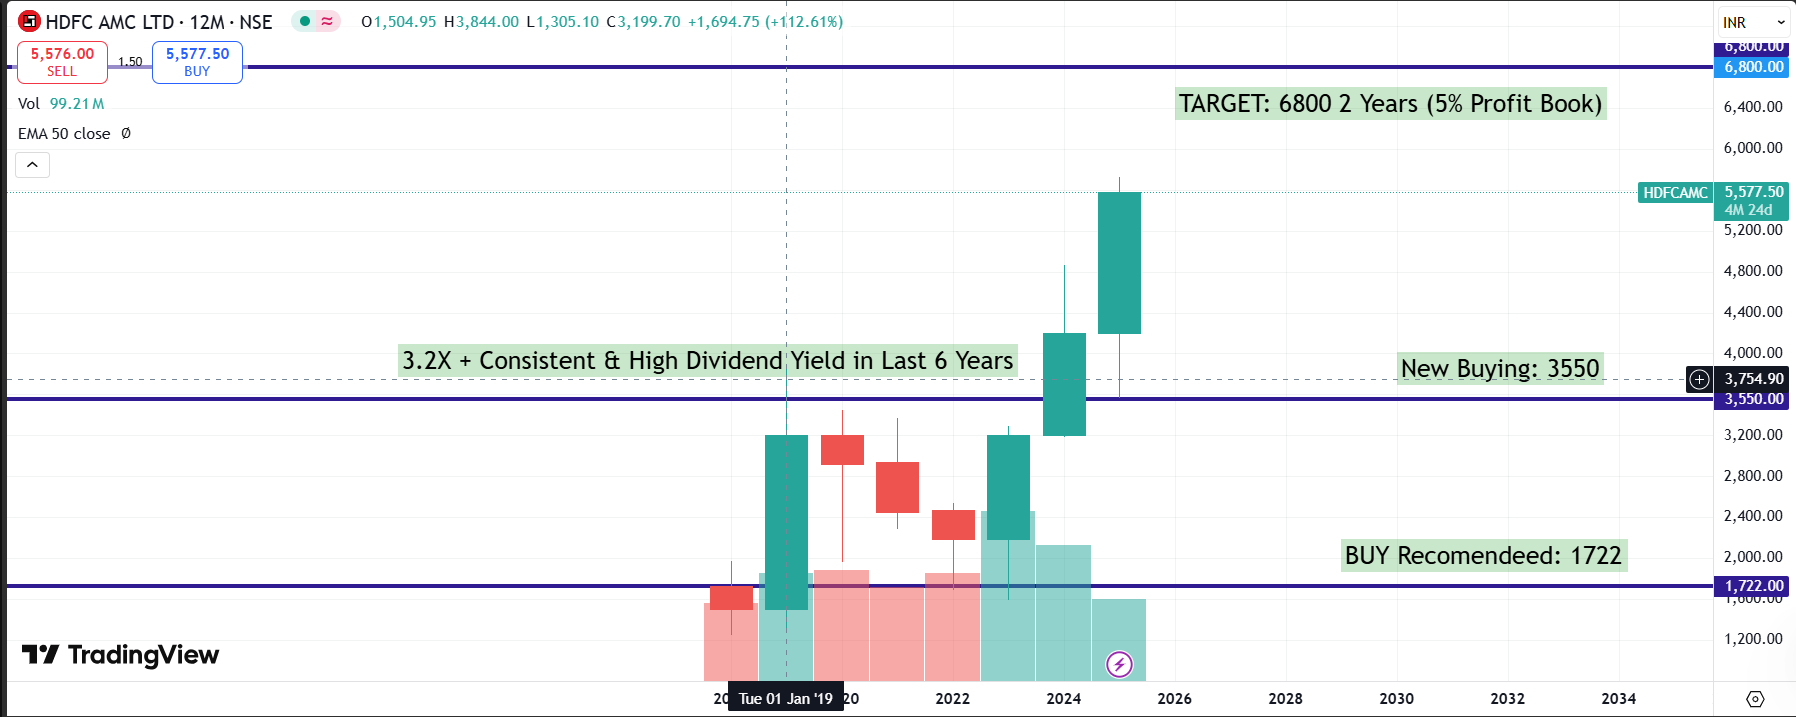
📉 Technical View (Based on Attached Chart)
Previous Buy Recommended: ₹1722 🟢
New Buying Zone: ₹3,550
Target (2 Years): ₹6,800 (Partial profit booking)
Dividend Track: 3.2x returns + consistent high yield in last 6 years.

✅ Conclusion – Long-Term Risk & Reward
Positives:
Industry leader with strong brand & distribution network
Sustained high margins & RoE
Large and growing retail investor base
Expanding AUM with market share stability
Risks:
Valuations near upper range historically
Market-linked revenue → sensitive to equity market cycles
Competition from new AMC entrants
🎯 Investor Approach: Accumulate in buying zones, hold for long-term compounding. SIP approach ideal for mitigating valuation risks.
📢 Disclosure
This report is for educational purposes only, based on publicly available information and reasonable assumptions. Not a recommendation. Investors should do their own due diligence.
