SBI Q1 FY26 Results: Steady Growth with Strong Asset Quality
🏦 Company Overview
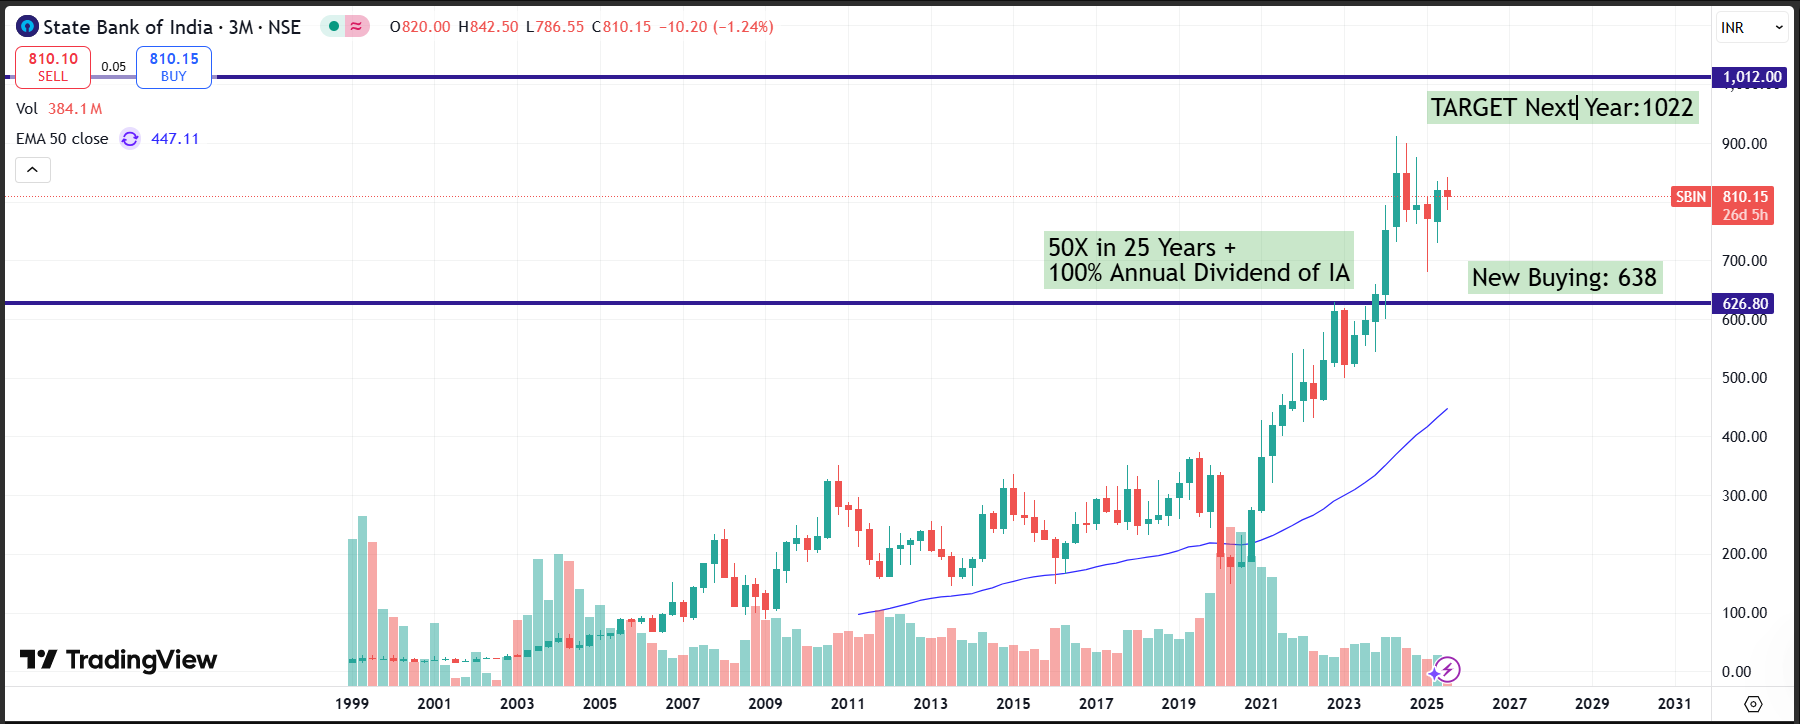
State Bank of India (SBI) is India’s largest public sector bank with a domestic market share of over 22%, a robust balance sheet, diversified subsidiaries (SBI Life, SBI Cards, SBI MF, SBI General, SBI Caps), and a strong digital franchise via YONO with 9+ crore registered users.
With advances of ₹42.5 lakh crore and deposits of ₹54.7 lakh crore as of Q1 FY26, SBI continues to dominate India’s banking sector across retail, SME, agriculture, corporate, and international segments.
📈 Industry & Growth Prospects
The Indian banking sector is in a strong growth cycle:
Credit growth driven by consumption, infrastructure, and digital finance adoption.
NPAs across the system have reduced, improving profitability.
SBI’s leadership in home loans (27.7% share) and auto loans (19.3% share) positions it well for India’s growing middle-class economy.
🔢 Q1 FY26 Performance Highlights
Key Takeaways:
✔ Net profit growth driven by other income and operating efficiency despite flat NII.
✔ Asset quality strengthened – GNPA at 1.83%, NNPA at 0.47%.
✔ Cost-to-Income ratio improved to 47.7% (from 49.4%).
✔ Provisions remained high at ₹11,384 Cr, providing a strong buffer.
📊 Segmental Performance (Q1 FY26)
Subsidiaries (Q1 FY26 profits):
SBI Life: ₹594 Cr (+14%)
SBI Card: ₹594 Cr (+7%)
SBI MF: ₹845 Cr (+24%)
SBI General: ₹188 Cr (+3%)
SBI Caps: ₹181 Cr (-13%)
📉 Cost & Provisioning Breakdown
Interest expenses: ₹76,923 Cr (+9.3% YoY)
Staff expenses: ₹16,900 Cr (+9.3% YoY)
Overheads: ₹10,974 Cr (+5.8% YoY)
Provisions: ₹11,384 Cr (+20.9% YoY), of which loan loss provisions ₹4,934 Cr.
🏦 Asset Quality & Capital Adequacy
Credit Cost: 0.47% (vs 0.48% last year).
PCR (Provision Coverage Ratio): 74.5%.
Additional provisions (outside PCR): ₹30,345 Cr (~152% of NNPA).
Capital Adequacy Ratio: 14.63% (CET1: 11.10%).
📉 Historical Trends
Advances CAGR (20 years): 16%
Profit CAGR (20 years): 16%
NPM improved to 11.9% in FY25–26 vs <7% a decade ago.
GNPA reduced from 6.2% in FY20 to 1.8% in FY26.
PE Range: Typically 7.8–10.5x in last 5 years.
PBV Range: 1.2–1.7x in last 5 years.
🔮 Estimates & Valuations
⚖️ Investment View
Positives:
✔ Strong earnings visibility (double-digit profit growth).
✔ Improving asset quality, NPAs at multi-year lows.
✔ Leadership in retail credit (home, auto, personal).
✔ Diversified income via subsidiaries.
✔ Consistent dividend track record.
Risks:
✘ NIM compression due to higher cost of deposits.
✘ Credit growth slowdown in corporate & infra segments.
✘ Global economic risks affecting international book.
🎯 Conclusion – Long-Term Risk & Reward
SBI remains a core holding for long-term investors, offering:
Stable growth (EPS CAGR ~12–15% for next decade).
High return ratios (ROE ~19–20%).
Attractive valuations at ~1.3x PBV and ~8–9x PE.
With its digital scale, strong subsidiaries, and reduced NPAs, SBI is well-positioned to deliver compounding returns till FY2035.
Portfolio Allocation Suggestion (Strategic Weightage): ~1.5% with tactical entry around fair value zones (PBV 1.2–1.4x).
📌 Disclosure: This analysis is for educational purposes only.
