🚀 LTTS – Engineering the Future of Technology | Long-Term Investment Analysis
📌 CMP: ₹4,238.50
🎯 Analysis Period: FY15–FY35 | Financials | Growth | Valuation | Technicals
🏢 Company Overview – L&T Technology Services (LTTS)
L&T Technology Services Ltd. (LTTS), a part of the Larsen & Toubro Group, is a pure-play Engineering R&D (ER&D) services company. It provides digital and engineering solutions across sectors like Hi-Tech, Transportation, Telecom, Plant Engineering, Industrial Products, and Medical Devices.
🌐 Industry Outlook – Engineering R&D (ER&D)
The global ER&D market is expected to exceed $1.9 trillion by 2026, with increasing outsourcing.
India’s ER&D exports to grow at a CAGR of ~12–14% over the next decade.
LTTS is among the top global ER&D service providers, well-positioned to ride the digital product engineering wave.
📊 Historical Performance (FY2015 to TRAILING FY26)
🔢 Revenue, Profit & Margins
🔍 Insights:
4.3x Revenue Growth and 4x Profit Growth over the last 10 years.
Margins have started compressing post FY22 due to rising costs.
📈 Q1 FY26 Financial Highlights
🧩 Segmental Revenue Breakdown – Q1 FY26
📌 Hi-Tech and Sustainability are driving growth; Mobility slightly declined.
⚙️ Major Operating Costs – Q1 FY26
📉 High employee cost is a key reason for margin compression in recent quarters.
📐 Historical Valuation Bands – PE & PBV
🔺 PE Range
🔻 PBV Range
📌 LTTS consistently trades at a premium PE & PBV, driven by high RoE, brand strength, and low-cap competition.
🔮 Long-Term Estimates & Valuation Projections
Assumption: EPS & Book Value CAGR ~13% | Margin Stability Post FY26 ~12.9%
💼 Portfolio Weight Suggestion
🏆 Good for diversified portfolios with moderate weight (1.5%–2%).
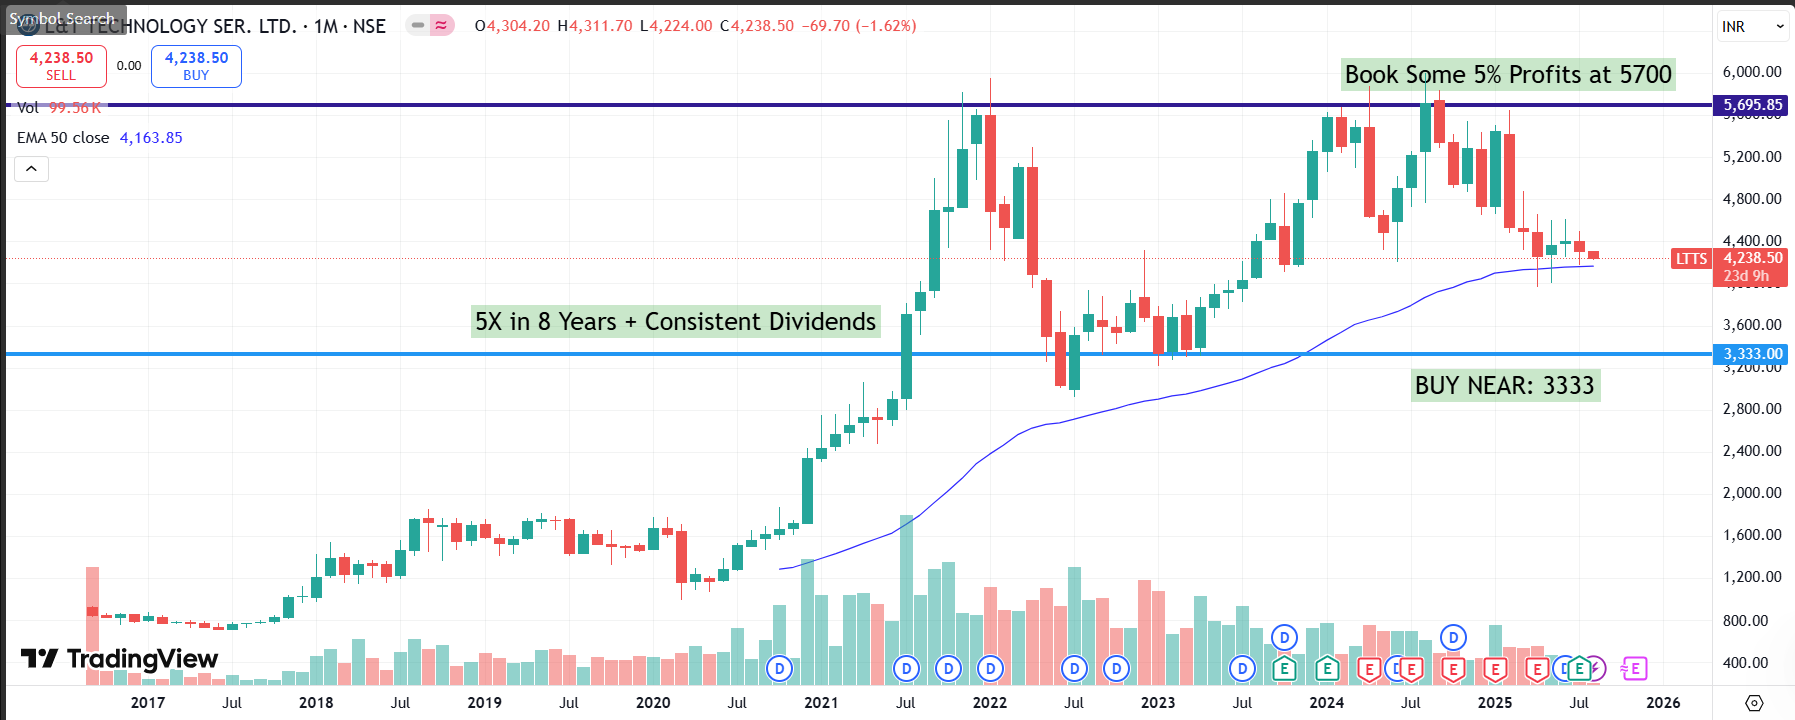
📉 Technical Analysis – Chart Insights

🔍 Key Technical Observations:
5X in 8 Years with consistent dividends.
📉 Current Price: ₹4,238.50 | 🧭 50 EMA: ₹4,163.85
✅ Buy Zone: ₹3,333 – Historical support.
💰 Profit Booking Zone: ₹5,700 – Technical resistance.
Price is near 50-month EMA – a strong base for long-term SIP investors.
Volume profile supports consolidation and accumulation.
✅ Conclusion – Risk and Reward for Long-Term Investors
👍 Positives:
Leader in high-growth ER&D industry.
Strong Hi-Tech and Sustainability portfolio.
Solid track record of returns and dividends.
Long-term digital transformation tailwinds.
⚠️ Risks:
Margin pressure from rising costs.
Slower profit growth in FY25–26.
High valuations may restrict short-term upside.
🎯 Verdict: A high-quality compounder with strong fundamentals, suited for patient long-term investors. Buy on dips near ₹3,333 with SIP approach; partial profit booking suggested at ₹5,700.
🔖 Disclosure
This blog is for educational purposes and long-term investing awareness. It is not investment advice. Investors must conduct their own research before making decisions.