Apollo Hospitals (AHEL) — FY26e Investor Deep-Dive
Snapshot • Tailwinds • Q1 FY26 KPIs • Segments • 30-Year History • Valuation Bands • Fair-Values • Risks • Portfolio Note
Apollo Hospitals (AHEL) FY26e: KPIs, Segment Mix, 30-Year History, Valuation Bands & Long-Term Outlook
Investor-grade analysis of Apollo Hospitals—Q1 FY26 KPIs (ARPP & occupancy), segment & cost mix, 30-year revenue/profit trends, historical PE/PBV bands, FY26/30/35 fair-value ranges, peer comparison, risks, and portfolio note.
📌 Executive Summary
Compounding leader: Multi-decade growth; Q1 FY26 shows double-digit revenue and strong profit momentum with improving operating leverage.
Integrated stack moat: Hospitals (HCS) + AHLL (Retail Health & Diagnostics) + HealthCo (Digital/Distribution).
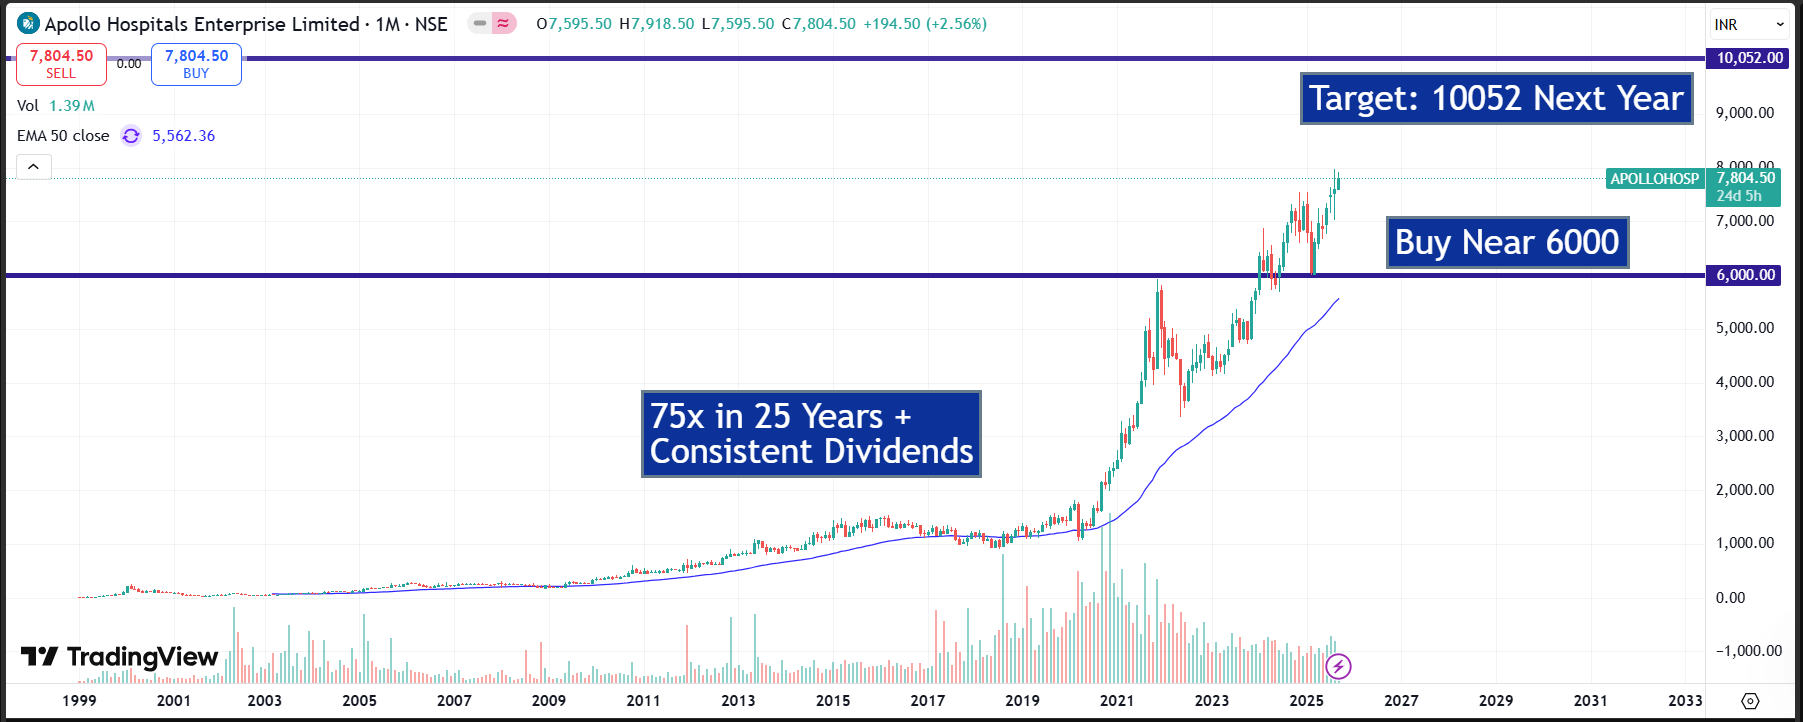
Valuation: Premium quality; FY30 blended fair value ~₹10,120 on your framework; FY35 ~₹16,870 (illustrative).
Key watch-outs: Bed-ramp, ARPP & mix, HealthCo break-even, and demerger execution.
🏥 Company Snapshot & Moats
Scale & network: Trusted pan-India brand with deep specialty mix (cardiac/oncology/neuro/gastro/ortho).
Omnichannel rails: Hospital + diagnostics + pharmacy/digital improves lifetime value & data flywheel.
Pricing power via complexity: Shift to ARPP (average revenue per patient) captures true realization per patient.
Operating discipline: Procurement, private labels, and mix management support margin resilience.
🌏 India Healthcare Tailwinds
Demand drivers: Aging population, lifestyle diseases (NCDs), insurance penetration, medical tourism.
Supply gap: Beds/1,000 below global averages; organized chains gain share.
Policy support: AB-PMJAY, infra upgrades, public-private partnerships.
Result: Multi-year runway for mid-teens growth for well-positioned leaders.
📊 Q1 FY26 KPIs (Consolidated)
Revenue: ₹5,842 cr | EBITDA: ₹852 cr | PAT: ₹433 cr
Trail EPS (not annualised): ₹109.4
ARPP: ₹1,72,282 (+9% YoY)
Occupancy: ~65%
🧩 Segment & Regional Mix; ⚙️ Cost Structure (Q1 FY26)
Revenue mix:
Healthcare Services (HCS): ~51%
AHLL (Retail Health & Diagnostics): ~7%
HealthCo (Digital & Distribution): ~42%
Visuals:
Segment Mix:
Cost Structure:
📈 30-Year Revenue, Profit & NPM
30-Year table (1995–Trail FY26):
Charts:
Revenue & Profit:
NPM% History:
🔢 Valuation Bands — Multi-Cycle Context
PE (low–high) bands and PBV (low–high) bands showcase premium through cycles; useful for mean-reversion framing.
PE Bands:
PBV Bands:
🎯 Scenario Fair-Values (EPS & PBV; blended)
Note: Bands are illustrative from your EPS/PBV frameworks; update as beds ramp, ARPP/mix evolves, and HealthCo profitability improves.
🤝 Peer Snapshot (Q1 FY26 unless noted)
Visuals:
Peer Occupancy:
Peer EBITDA Margin:
⚠️ Risks & What to Track
Execution: Timely bed additions and occupancy ramp.
Pricing/regulatory: Insurance reimbursements, policy caps.
Case-mix & ALOS variability (intl patients, specialty mix).
Digital economics: HealthCo profitability and break-even trajectory.
Demerger execution: Pharmacy/Digital separation milestones & timelines.
🧭 Portfolio Weighting Note (Illustrative)
Reference price ₹7,830; Strategic weight ~1.45%, factor 0.71 ⇒ Tech weight ~1.03%.
Adjust with your MFS/TAF, client risk bands, and valuation cycle signal.
🧾 Disclosures
Educational content for investors. Not investment advice or a SEBI research report. Use with your diligence, risk tolerance, and horizon.
