Dixon Technologies (India) Ltd. Q3 FY25 Results 📊
Financial Highlights:
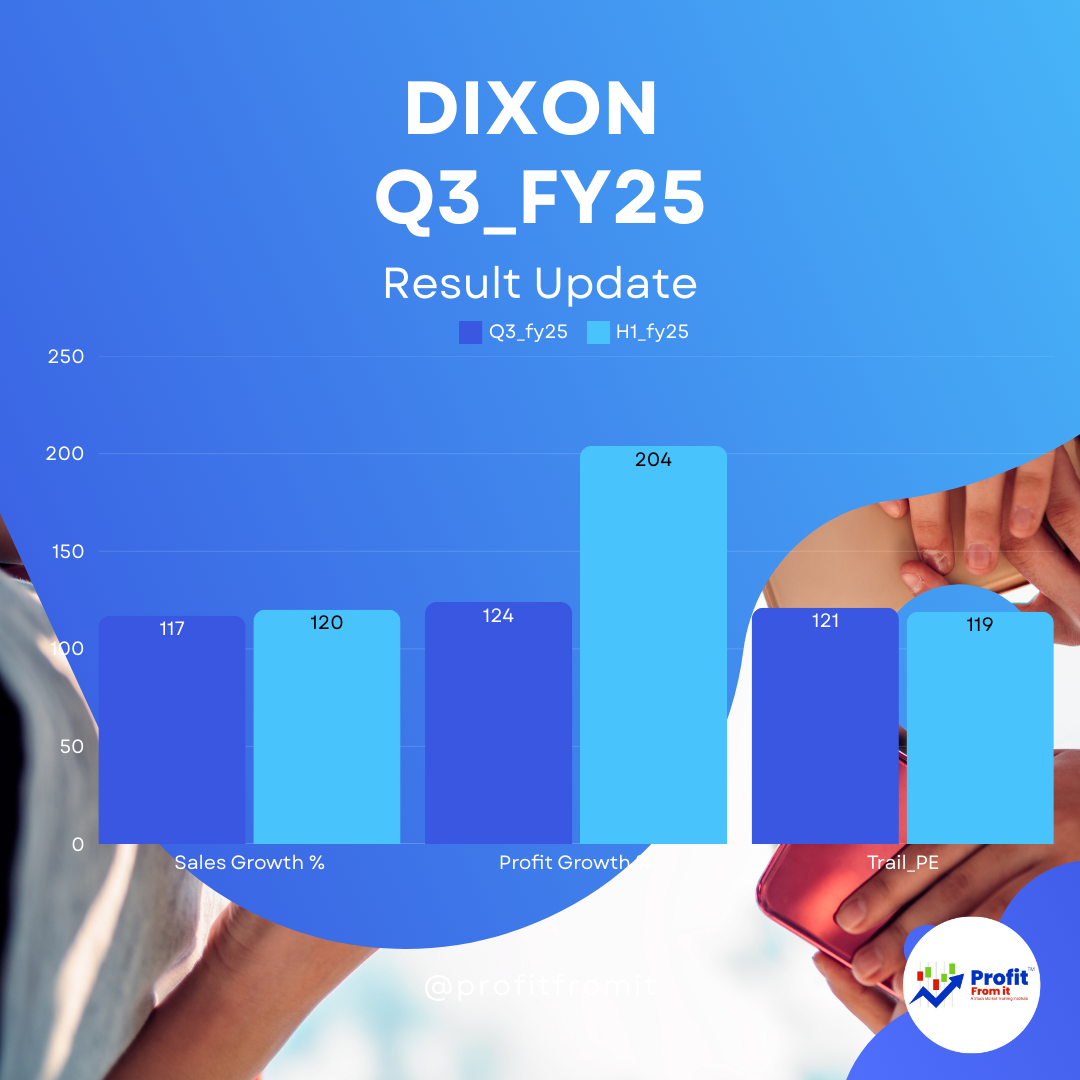
Consolidated Revenue Growth (Q3 FY25 vs. Q3 FY24):
Revenue rose significantly to ₹10,461 crores, marking a 117% increase compared to Q3 FY24 💹. Growth is inline as during H1_fy25 it was 120%.
This growth is attributed to substantial increases in production volumes and expansion in product lines 📈.
Segmental Revenue Growth:
The Mobile & EMS division saw an 89% revenue contribution with a significant YoY increase, reflecting robust demand in consumer electronics and mobile devices 📱.
Other segments like Consumer Electronics & Appliances, Home Appliances, and Lighting Products also showed healthy growth but contributed less to the overall revenue 💡.
Profit Margins (Q3 FY25 vs. Q3 FY24):
EBITDA Margin: Slightly declined by 0.1% to 3.8% 📉.
Profit Before Tax (PBT) Margin: Increased slightly to 2.7% 📊.
Net Profit After Tax (PAT) Margin: Also saw a slight increase to 2.1% ➕.
The modest margin expansion reflects operational efficiency improvements, slightly offset by increased raw material costs 🏭.
Profit Growth (Q3 FY25):
Profit Before Tax (PBT): Increased by 127% YoY to ₹286 crores 🚀.
Net Profit After Tax (PAT): Increased by 124% YoY to ₹217 crores 💰.
The strong growth in profits can be attributed to higher revenue and efficient cost management despite increased expenses.
Key Industry KPIs (as of Q3 FY25):
Return on Equity (ROE): Stood impressively at 40.4%, indicating highly effective utilization of equity 🔝.
Return on Capital Employed (ROCE): Was 42.6%, reflecting efficient capital utilization 💼.
Net Debt-to-Equity Ratio: Improved to 0.06, showing strong financial stability and lesser reliance on external borrowings 🔐.
Financial Health and Outlook:
Liquidity Ratios:
Current Ratio and Quick Ratio are in a healthy range, indicating good short-term financial health 🌊.
The company maintains a robust cash flow position, enabling it to meet short-term obligations and invest in growth opportunities 💧.
Solvency Ratios:
The company shows a strong solvency position with low leverage, indicating a lower risk of financial distress 🛡️.
Valuation at Current Market Price (CMP) of ₹17,555:
Given the robust growth in revenue and profits, the trail EPS is 121 & Trail_PE is 121, Considering strong growth F_EPS estimate comes to 167.8 & F_PE to 100 which is properly valued considering strong growth. 📈.
Near-Term and Long-Term Outlook:
Near-Term:
Continued expansion in mobile and EMS segments expected to drive revenue 📱.
Profit margins are anticipated to remain stable with potential for improvement through strategic cost management and efficiency gains 🔄.
Long-Term:
Investments in technology and capacity expansion are likely to solidify market position and drive sustainable growth 🌱.
Diversification into new consumer electronics and smart technology products could open additional revenue streams 🚀.
Overall, Dixon Technologies appears well-positioned for sustained growth with strong financial health and effective management strategies in place. The company's focus on high-growth segments and operational efficiency is likely to continue yielding positive results for shareholders 💼💵.
Disclosure: Do not consider this document as recommendations as we are not tip providers, the document is prepared for educational purposes.
---------------------------------------------------------
