SBI's Q3FY25 Analysis 🚀📊💡
📢 SBI Q3FY25 Earnings Analysis & Insights 📊🏦
1️⃣ Key Financial Highlights 💰📈
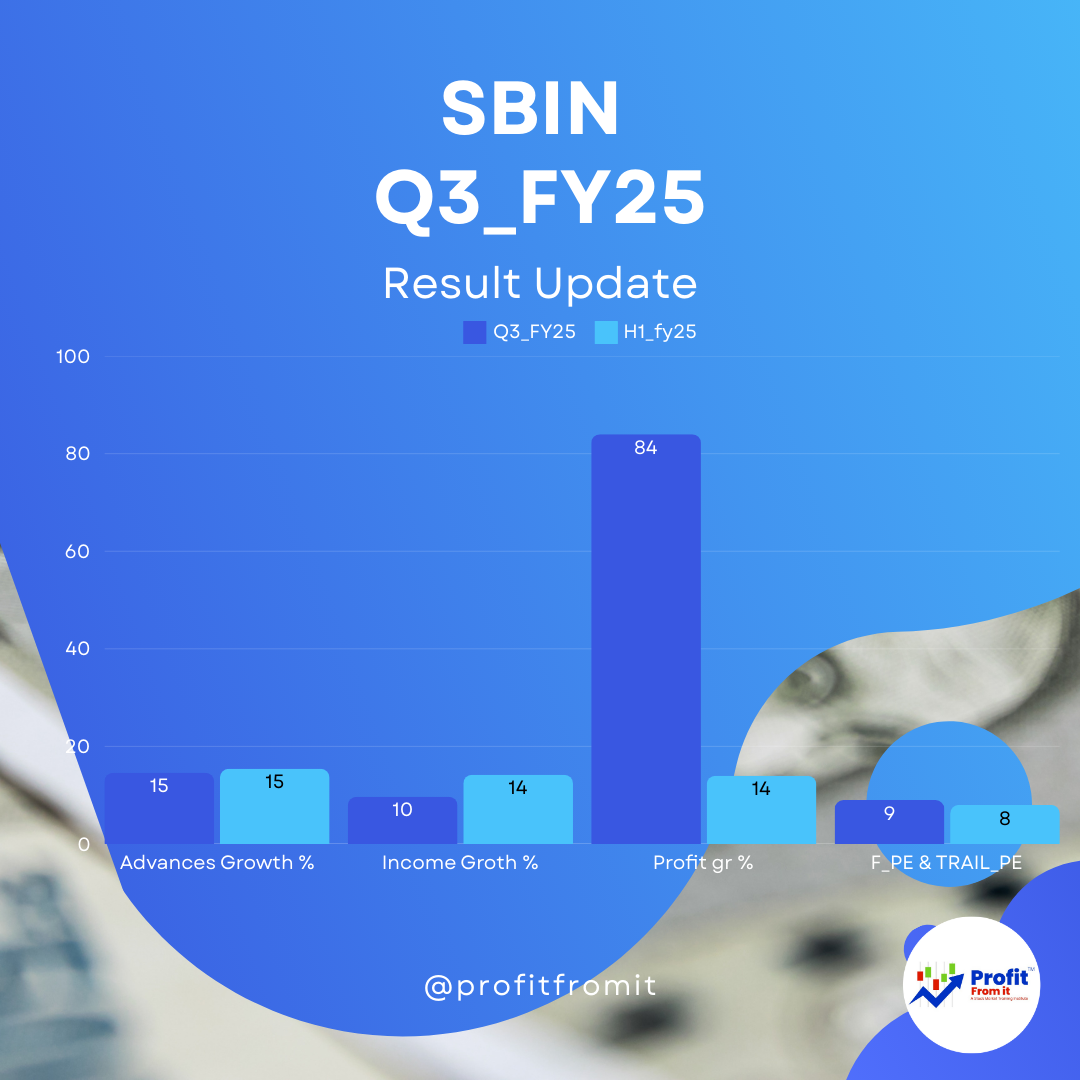
💵 Net Profit: ₹16,891 crores (+84.32% YoY) 📊✅.
📊 Operating Profit: ₹23,551 crores (+15.81% YoY) 🔼.
🏦 ROA (Return on Assets): 1.09% 📈 (vs. 0.94% in 9MFY24).
💰 ROE (Return on Equity): 21.46% 💹 (vs. 19.47% in 9MFY24).
💳 Net Interest Income (NII): ₹41,446 crores (+4.09% YoY) 🏦.
📉 Net Interest Margin (NIM):
Whole Bank: 3.01% ⬇️ (vs. 3.22% in Q3FY24).
Domestic NIM: 3.15% ⬇️ (vs. 3.34% in Q3FY24).
2️⃣ Advances & Deposits Growth 💼📊
📊 Domestic Credit Growth: 14.06% YoY 🚀 (₹40.67 lakh crores).
🏭 SME Advances: 18.71% YoY ⬆️.
🌾 Agri Advances: 15.31% YoY 🌱📈.
🏢 Corporate Advances: 14.86% YoY 🏦📊.
🏡 Home Loans: ₹7.92 lakh crores (+14.26% YoY) 🏠💸.
💰 Whole Bank Deposits: ₹52.29 lakh crores (+9.81% YoY) 📈.
💳 CASA Deposits: ₹19.65 lakh crores (+4.46% YoY) 💰.
💼 CASA Ratio: 39.20% 📉 (-198 bps YoY).
3️⃣ Asset Quality (GNPA & NNPA) 🏦🛡
📉 Gross NPA (GNPA): 2.07% ✅ (improved by 35 bps YoY).
💰 Net NPA (NNPA): 0.53% 📉 (improved by 11 bps YoY).
🔰 Provision Coverage Ratio (PCR): 74.66% 🔼 (+49 bps YoY).
📉 Slippage Ratio (Q3FY25): 0.39% ⬇️ (-19 bps YoY).
💰 Credit Cost: 0.24% for Q3FY25, 0.37% for 9MFY25 📉.
4️⃣ Consolidated Sales Growth (Q3FY25 & 9MFY25) 📊💹
📈 Consolidated Interest Income (Q3FY25): ₹1,24,654 crores ⬆️ (vs. ₹1,12,868 crores in Q3FY24).
📈 9MFY25 Consolidated Interest Income: ₹3,63,941 crores (vs. ₹3,21,719 crores in 9MFY24) 🏦.
📊 9MFY25 Consolidated Total Income: ₹4,83,781 crores (+12.6% YoY) 💰.
💹 9MFY25 Consolidated Net Profit: ₹59,075 crores (+29.42% YoY) 🚀.
5️⃣ Profit Margin Analysis (Q3FY25 vs Q3FY24) 💵📊
📈 Net Profit Margin: 13.15% 🏦 (vs. 7.75% in Q3FY24) 📊.
📊 Operating Profit Margin: 18.34% 💰 (vs. 17.21% in Q3FY24) 📉.
6️⃣ Subsidiaries Share & Growth 📈🏢
📊 Insurance Business: Revenue at ₹32,265 crores (+13.2% YoY) ✅.
🏦 Mutual Funds & Wealth Management: Higher AUM growth 📊📈.
💳 SBI Cards: Strong performance in credit card spends & fee income 💰.
🌎 International Banking: 10.35% YoY growth in advances, led by New York, Singapore, Dubai, and Hong Kong 📊.
7️⃣ Other Industry KPIs 📲💡
📱 YONO Digital Banking: 8.45 crore+ users 🎉 (64% of new SB accounts opened digitally).
🌐 Alternate Channels Transactions: 98.1% of total transactions 📊📲.
🏠 Market Share in Home Loans: 26.9%, Auto Loans: 20.1% 🚗💰.
8️⃣ Profitability, Solvency, Liquidity & Valuation Ratios at CMP ₹753 📉📊
📊 Price-to-Earnings (P/E) Ratio: 8x 🔥.
📈 Price-to-Book (P/B) Ratio: 1.47x 📊.
💰 Debt-to-Equity Ratio: 0.70 ✅.
🏦 Capital Adequacy Ratio (CAR): 13.03% 🏦.
🔰 CET-1 Ratio: 9.52% (+43 bps YoY) ✅.
9️⃣ Near-Term & Long-Term Outlook 🚀📊
📅 Near-Term (6-12 Months)
✔ Strong earnings momentum driven by loan growth & stable margins 📊.
✔ Improved asset quality with lower NPAs 🛡.
✔ NIM pressure might continue due to higher interest expenses 📉.
✔ SBI’s digital transformation through YONO to enhance efficiency 📲✅.
✔ Stable provision coverage ensures risk protection 📊.
📅 Long-Term (3-5 Years)
✅ Loan book growth to remain in double digits 🚀.
✅ Digital Banking Expansion via YONO & AI-driven banking 📲🤖.
✅ Lower NPA levels & higher provisioning coverage 📉🛡.
✅ SBI’s strong capital position to drive higher ROE 📈.
✅ Potential for dividend growth 💰💹.
✅ CMP ₹753 is attractive, making SBI a strong long-term bet 🔥.
🔥 Final Verdict: SBI Q3FY25 – A Solid Performer! 🚀💰
✅ Outstanding profit growth (+84% YoY).
✅ Strong loan & deposit growth 📈.
✅ GNPA/NNPA improving with higher PCR (74.66%) 🛡.
✅ Digital expansion driving efficiency 📲.
✅ Attractive valuation at 1.47x P/B, a strong long-term investment 📊💰.
📢 Disclaimer & Disclosure Statement
Important Investor Advisory Notice
This research analysis is for informational purposes only and should not be considered as financial, investment, or legal advice. The information provided herein is based on publicly available financial reports, market data, and our analysis. Investors are advised to exercise caution and discretion before making any investment decisions.
