🎨 Asian Paints Q3 FY25 & 9M FY25 Financial Analysis & Insights 📊
🔹 1. Key Highlights 📢 Demand still muted
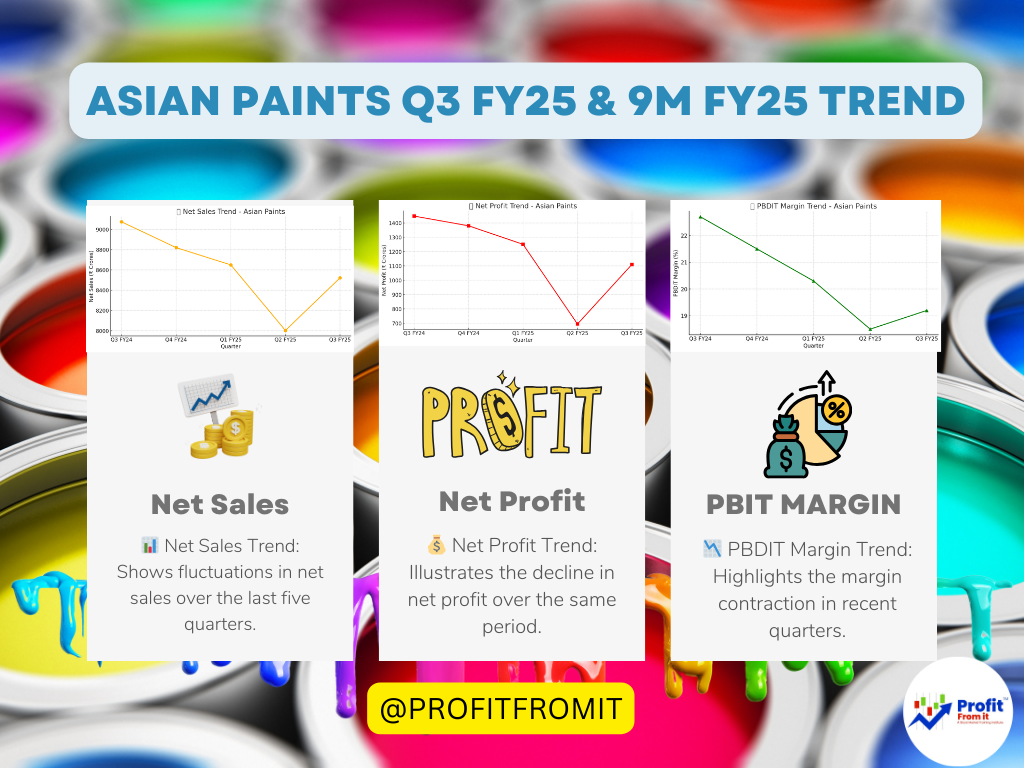
📉 Q3 FY25 Consolidated Net Sales: ₹8,522 crores (⬇ 6.1% YoY)
📉 Q3 FY25 Consolidated PAT: ₹1,110.5 crores (⬇ 23.3% YoY)
📉 9M FY25 Consolidated Net Sales: ₹25,467.8 crores (⬇ 4.5% YoY)
📉 9M FY25 Consolidated PAT: ₹2,975.1 crores (⬇ 29.2% YoY)
📊 Decorative Business (India) Volume Growth: 📈 1.6%
📉 Consolidated PBDIT Margin: 19.2% (⬇ 350 bps YoY)
📦 2. Volume Growth 📊
🔵 Decorative Business (India) Volume Growth: 📈 1.6% YoY
🔵 Growth Challenges: Weak demand, downtrading, weak festive season
🔵 Industrial Business Growth: 📈 3.8% YoY (General Industrial & Refinish segments)
📈 3. Consolidated Sales Growth 💰
📅 Q3 FY25 vs Q3 FY24
Net Sales: ₹8,522 crores (⬇ 6.1% YoY)
Factors: Weak demand in urban centers, seasonal demand slowdown
📅 9M FY25 vs 9M FY24
Net Sales: ₹25,467.8 crores (⬇ 4.5% YoY)
International Business: 📈 5% growth in INR terms (📈 17.1% constant currency)
🌎 4. Segmental & Regional Performance 🌏
🏠 Domestic Decorative Business 🖌️
✔ Q3 FY25 Volume Growth: 📈 1.6%
✔ Revenue Decline: 📉 7.8%
✔ Weak festive demand & downtrading impacted sales
🏭 Industrial Business 🏗️
✔ Overall Growth: 📈 3.8%
✔ General Industrial & Refinish segments drove growth
🌍 International Business 📊
✔ Revenue Growth: 📈 5% in INR terms, 📈 17.1% constant currency basis
✔ Best performing regions: 🏝️ Middle East, 🇱🇰 Sri Lanka, 🇧🇩 Bangladesh, 🇳🇵 Nepal
✔ Challenges: 📉 Currency devaluation in 🇪🇹 Ethiopia & 🇪🇬 Egypt
🏡 Home Décor Business 🛋️
✔ Q3 FY25 Sales:
🛀 Bath Fittings: ₹87.6 crores (📈 2.6%)
🍽️ Kitchen Business: ₹102.7 crores (📈 2.7%)
🔥 White Teak: ₹26.0 crores (📉 -22.8%)
🏠 Weatherseal: ₹11.8 crores (📉 -14.1%)
📊 5. Profit Margins Analysis 💹
📅 Q3 FY25 vs Q3 FY24
Consolidated PBDIT Margin: 📉 19.2% vs 22.7% (-350 bps)
Net Profit Margin: 📉 13.0% vs 15.9%
📅 9M FY25 vs 9M FY24
Consolidated PBDIT Margin: 📉 17.9% vs 22.1% (-420 bps)
🚨 Margin Pressures:
📉 Higher sales & distribution expenses
📉 Adverse product mix
📉 Weak domestic demand
📈 6. Consolidated Profit Growth 💰
📅 Q3 FY25 vs Q3 FY24
Profit Before Tax (PBT): ₹1,518.2 crores (📉 22.8% YoY)
Net Profit (PAT): ₹1,110.5 crores (📉 23.3% YoY)
📅 9M FY25 vs 9M FY24
PBT: ₹4,261.0 crores (📉 25.6% YoY)
Net Profit (PAT): ₹2,975.1 crores (📉 29.2% YoY)
📊 7. Profitability, Solvency, Liquidity & Valuation 💹
✅ Profitability Ratios at CMP ₹2345
📊 Return on Equity (ROE) (TTM): 📈 ~22-24%
📊 Return on Capital Employed (ROCE): 📈 ~25-27%
📊 EBITDA Margin: 📈 ~18-20%
📊 Net Profit Margin: 📈 ~12-14%
💰 Solvency & Liquidity
✔ Debt-to-Equity Ratio: 🔹 0.02-0.05x (Low debt, strong balance sheet)
✔ Current Ratio: 🔹 ~1.6-1.8x (Good liquidity)
✔ Interest Coverage Ratio: 🔹 >10x (Strong financial health)
📈 Valuation Ratios at CMP ₹2345
💰 PE Ratio (TTM): 📈 ~50-55x (Premium valuation)
💰 EV/EBITDA: 📈 ~30-32x (Expensive vs historical levels)
💰 Price-to-Book Value (P/B): 📈 ~12-14x (High valuation)
🚀 8. Near-term & Long-term Outlook 🔮
📆 Near-Term (6-12 months)
📉 Muted demand recovery expected in urban markets
📉 Margin pressures due to competition & inflation
📉 High valuation limits upside potential
📈 Potential rural & Tier 2-3 city demand growth
📈 Long-Term (2-5 years)
🏆 Strong market leadership & pricing power
🏭 Expansion in Industrial Coatings & International Business
🏡 Home Décor segment poised for long-term growth
📊 Strategic acquisitions & innovation will boost profitability
🎯 Final Takeaway 🎯
💡 Short-Term: 📉 Weak demand, lower margins, expensive valuation
💡 Long-Term: 📈 Strong fundamentals, market leader, high growth potential
