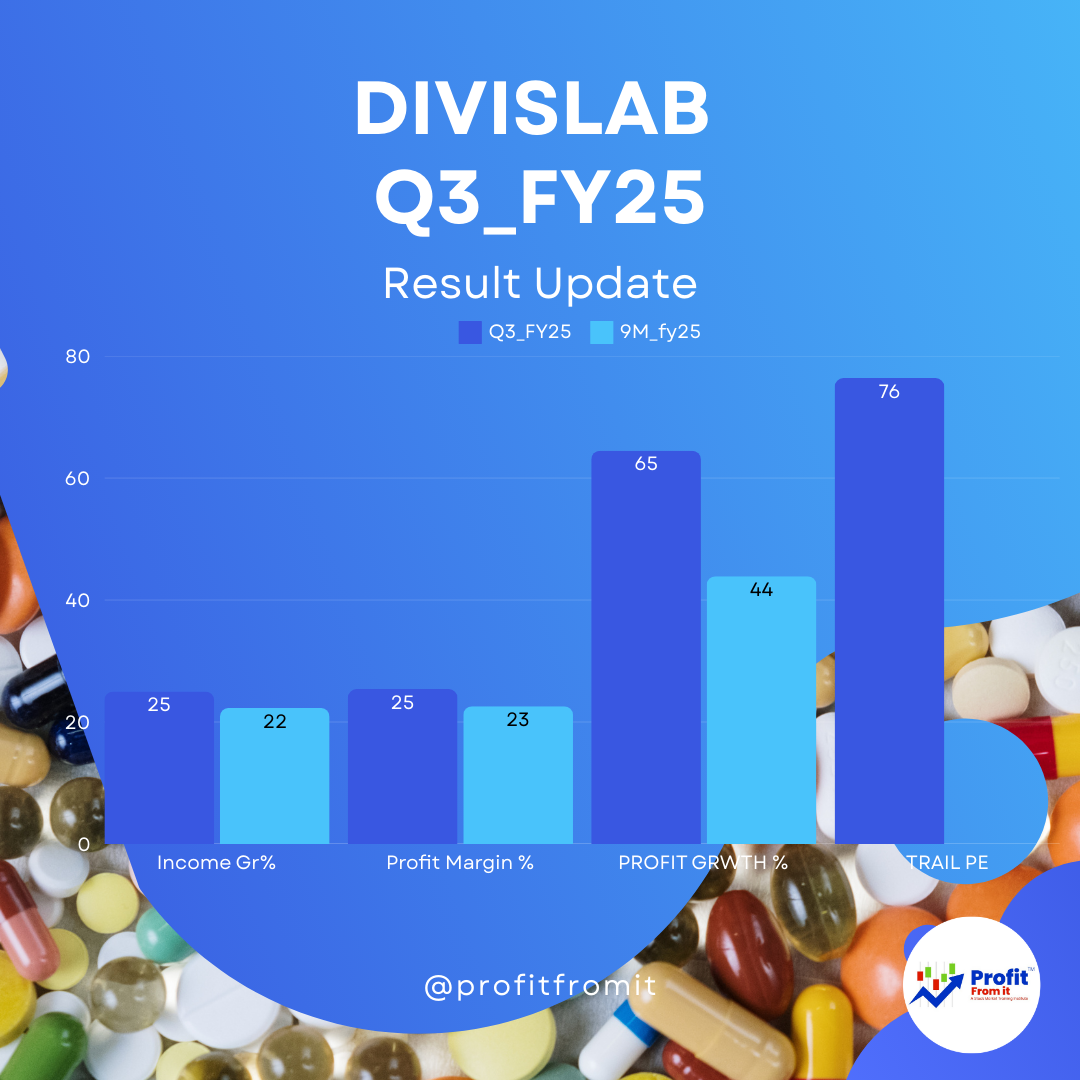
📢 Divis Laboratories Q3 FY25 & 9M FY25 Results - 📊💡
📌 Key Highlights
✅ Revenue Growth: Strong YoY growth in both Q3 FY25 & 9M FY25 📈
✅ Profitability: Higher PAT Margins & EBITDA Expansion 💰
✅ Capex Update: Kakinada Project (Unit-III) started operations from Jan 1, 2025 🏭
✅ Valuation: CMP ₹5,889 – Trading at a premium valuation 📊
1️⃣ Financial Performance 📊
📈 Consolidated Sales & Profit Growth
2️⃣ Margin Analysis 📊💰
📌 Higher EBITDA & PAT Margins indicate efficiency improvements & cost control ✅
📌 Slight dip in Gross Margin due to raw material costs ⚠️
3️⃣ Profitability, Solvency, & Liquidity Analysis 💰📊
📈 Profitability Ratios
🔹 RoE & RoCE show strong earnings growth, making the stock attractive 📈💰
🔹 Solvency & Liquidity 🏦
✅ Minimal debt, strong liquidity, and high cash reserves ensure financial stability 📉
4️⃣ Valuation Analysis 💰 CMP ₹5,889 & Trail EPS of 77.85
📌 Stock trades at a premium due to its strong financials & growth potential 💰📊
5️⃣ Outlook - Short & Long Term 📆
🔹 Near-Term (Next 1 Year)
✅ Revenue Growth Momentum Continues 🚀
✅ Margin Expansion Likely 💰
✅ Capacity Expansion (Kakinada) to Add Further Growth 🏭
⚠️ Risks: Currency fluctuations & raw material price volatility 🌍💰
🔹 Long-Term (2-5 Years)
✅ Strong API & Nutraceuticals Demand 📈
✅ Ongoing Expansion to Boost Production Capacity 🏭
✅ Robust R&D for Future Growth 🧪🔬
6️⃣ Final Verdict 🎯
📢 Exceptional Q3 & 9M FY25 results with strong profitability & growth. ✅
💰 Low debt, strong liquidity & margin expansion make it financially stable. 📊🏆
📈 Premium valuation reflects high growth potential but caution needed at CMP ₹5,889. 🚀
🔹 Investment View:
📍 Near-term traders: Hold, watch valuation risks ⚠️
📍 Long-term investors: Attractive for consistent returns in pharma sector 💼💊
💬 What’s your take on Divis Lab’s growth story? Comment below! 👇
#DivisLabs #StockMarket #Earnings #PharmaStocks #Investment #Q3Results

Class Sessions
1- IREDA’s latest quarterly results
2- Patanjali's Q2 FY25 financials
3- United Breweries Limited - Detailed Q2 FY25 Consolidated Financial Analysis
4- HDFC LIFE Q1 FY 2025
5- DMart Q1 FY 2025
6- HDFC LIFE Q1 FY 2025
7- Bajaj Auto Q1 FY24 Analysis
8- IREDA Q1 FY 2024
9- TCS Q1 FY 2025
10- HDFC Asset Management Company (HDFC AMC) Q1 FY25 Analysis
11- BAJAJ FINANCE | BEL | VOLTAS | LT | MARUTI SUZUKI Q3 Result Update 2024
12- How do you Analyse NBFC companies?
13- Which company is best for home appliances?
14- Who is No 1 construction company in India?
15- Aerospace & Defense Industry
16- Passenger Vehicle Market Share
17- Which is the No 1 small finance bank in India?
18- What is the position of steel market in India?
19- Tyres & Rubber Products INDUSTRY
20- Computers-Software & Consulting_q3_fy24
21- Which is the best stock in Consumer Food? Watch Now
22- Auto Sector Vehicle January Data
23- Telecom Industry in India: Sector Overview
24- Comparision: Reliance Retail | Dmart | ShoppersStop | Spencer | Vmart
25- ICICI GI, Supreme Industry, Asian Paint & Ultratech Cement | Q3 FY2024 Result Update
26- TCS, Dmart, HDFC AMC & HDFC LIFE Q3 FY2024 Result Update
27- LTTS, MAPMYINDIA, HDFC BANK Q3 FY2024 Result Update
28- Hospital Industry Analysis
29- Industry Update
30- Tata Consultancy Services Ltd Q4 Result Update 2023
31- Ultratech Cement Latest News | Q4 Result 2023
32- Q4 Result 2023
33- Q3 Result Update 2023
34- Student Page Video
35- Live Query Sessions Video Updated
36- TCS's Q3 FY25: (Leading Company from Computers - Software & Consulting Industry)
37- TATAELXSI's Q3 FY25:
38- IREDA's Q3 FY25:
39- Avenue Supermarts Limited's (DMart) financial results for the third quarter ended December 31, 2024:
40- HDFC Asset Management Company's financial results for Q3 FY25:
41- HDFC Life Q3 FY25 Analysis 📊
42- L&T Technology Services Q3 FY25
43- Havells Q3 FY25 Analysis 📊
44- Reliance Industries' Financial Results for Q3 FY25 📊
45- ICICI Lombard's performance for Q3 FY25”
46- Q3 FY25 Supreme Industries Ltd. 📊
47- Indian Railway Finance Corporation Limited (IRFC) for Q3 FY25:
48- Zomato's Q3 FY25 financial results:
49- Dixon Technologies (India) Ltd. Q3 FY25 Results 📊
50- HDFC BANK Q3 FY25 Results 📊
51- Hindustan Unilever Q3 FY25 Results 📊
52- Pidilite Industries Limited's Q3 FY25:
53- UltraTech Cement Limited for the third quarter (Q3) and the first nine months (9MFY) of the financial year 2025:
54- Indian Energy Exchange (IEX) Q3 FY25:
55- AU Small Finance Bank Limited's Q3 FY25:
56- Indigo Airlines' performance for Q3 FY25: Overview: 🚀
57- Balkrishna Industries Q3 FY25 Performance Analysis 📊
58- CDSL's financial results for Q3 FY25: Key Insights and Highlights
59- EMS Limited's financial results for Q3 FY25:
60- JSW Steel's Q3 FY25 financial performance:
61- Wonderla Holidays Limited Q3 FY25 Analysis 📊
62- Bajaj Housing Finance's latest results for Q3 FY25;
63- Route Mobile's latest financial results for Q3 FY25:
64- Bajaj Auto Q3 FY25 Consolidated Financial Analysis:
65- Maruti Suzuki India Limited (MSIL) - Q3 FY25 Financial Highlights and Analysis 📊
66- Q3 FY25 results for C.E. Info Systems Limited (MapMyIndia)
67- Bajaj Finance's Q3 FY25: 📊
68- Voltas' Q3 FY25 financial results:
69- 📢 BEL Q3 FY25 Results – Key Insights & Analysis 🚀
70- 📊 Waaree Energies Q3 FY25 and 9M FY25 Performance Analysis 🚀
71- 📊 Dr Lal PathLabs - Q3 FY25 & 9M FY25 Financial Analysis & Insights 🚀
72- Larsen & Toubro Q3 FY 25: 🚀📊📈
73- 📊 Analysis of Tata Consumer Products Q3 FY25 & 9M FY25 Results 📈
74- 📊 Manyavar (Vedant Fashions Ltd.) Q3 FY25 Earnings
75- Nestlé India Q3 FY25 results:
76- 📢 Divis Laboratories Q3 FY25 & 9M FY25 Results - 📊💡
77- 🎨 Asian Paints Q3 FY25 & 9M FY25 Financial Analysis & Insights 📊
78- 📊 Godrej Properties Q3 FY25 Analysis 🏗️
79- 📊 Kajaria Ceramics Q3 FY25 Analysis 📊
80- 📊 Titan Q3 FY25 & 9M FY25 Performance Analysis 🔥🚀
81- 🚀 InfoEdge Q3FY25 Results Analysis & Insights 📊
82- 📊 Page Industries Q3 FY25 Analysis & Investment Insights 🏭📈
83- 📢 SBI Q3FY25 Earnings Analysis & Insights 📊🏦
84- 📊 PI Industries Q3 FY25 Results - Analysis & Insights 🔍
85- 🚀 Amara Raja Batteries (ARE&M) Q3 FY25 Results Analysis and Insights 📊
86- 📊 Affle (India) Limited Q3 & 9M FY2025 Earnings Analysis & Insights 🚀
87- 📊 Patanjali Foods Limited Q3 FY25 Financial Analysis & Key Insights 🚀
88- 📊 Apollo Hospitals Q3FY25 & 9MFY25 Financial and Operational Analysis
89- 🚄 IRCTC Q3FY25 Earnings Analysis & Insights 📊💡
90- 🎯 Jubilant FoodWorks Q3FY25 & 9MFY25 Key Highlights 🚀🔥
91- 📊 UBL Q3 FY25 & 9M FY25 Performance Analysis – Investor Insights 💹
92- 🚢 Mazagon Dock Shipbuilders: Q3FY25 & 9MFY25 Analysis
93- 📈 TCS FY25 Results: Muted CC Growth, Hence Low Sales & Profit Growth in Headwind Environment, but valuations near to favourable.
94- 🔋 IREDA Q4FY25 Results: Powered by Growth, Poised for the Future
95- 📊 ICICI Lombard General Insurance – FY25 & Q4 FY25 Results Update
96- 🔍 HDFC AMC Q4FY25 & FY25 Results: Strong Performance, Robust Growth & Healthy Margins
97- 📈 HDFC Life FY25 Results: Strong Growth, Steady Profits & Enhanced Market Position
98- 📊 Tata Elxsi Q4FY25 & FY25 Review: Growth Foundations Amidst Headwinds
99- 🔍 HDFC Bank – FY25 & Q4FY25 Results Highlights
100- 📊 Havells FY25 Results Analysis: Robust Growth with Strategic Resilience
101- Waaree Energies Ltd. (WAAREEENER) FY25 Results Update & Investor Insights
102- 📊 AU Small Finance Bank Q4 & FY25 Results – Growth Anchored by Profitability & Prudent Risk Management
103- Bajaj Housing Finance Ltd. – FY25 Financial Performance Highlights and Analysis
104- Tata Consumer FY25 & Q4FY25 Summary: Strong Growth with Margin Recovery on the Horizon
105- L&T Technology Services (LTTS) Q4 FY25 & FY25 Results Analysis
106- Hindustan Unilever Limited (HUL) FY25 & Q4FY25 Results Update
107- 📊 Nestlé India Limited – FY25 & Q4FY25 Results Analysis
108- 📊 IEX FY25 and Q4FY25 Results Analysis
109- Supreme Industries Limited – FY25 Financial Results Update
110- Maruti Suzuki FY25 Results Update: Key Insights and Strategic Highlights
111- Reliance Industries Limited – FY25 Results Update
112- UltraTech Cement FY25 Results Update: Driving Consolidated Growth Amidst Strategic Expansions
113- Bajaj Finance Limited – Q4FY25 and FY25 Financial Results Update
114- 📊 Eternal Limited – Q4FY25 & FY25 Financial and Strategic Performance Update
115- 🏢 Godrej Properties Q4 & FY25 Result Analysis: Booking Boom & Financial Resilience
116- 🧾 DMart Q4 FY25 & FY25 Result Highlights – Resilient Growth Amid Operational Pressures
117- 📊 CDSL Q4 & FY25 Result Analysis
118- 📊 Kajaria Ceramics Q4 FY25 Results Analysis 📈
119- Manyavar (Vedant Fashions Limited) Q4 FY25 Financial Analysis
120- Wonderla Holidays Q4FY25 & FY25 Financial Analysis: Strong Footfalls Despite Market Headwinds
121- 📊 Voltas Q4 FY25 Financial Analysis: Detailed Investor Insights
122- 📊 Route Mobile Q4 FY25 & FY25 Financial Analysis
123- United Breweries Limited (UBL) Q4 FY25 Financial Analysis
124- Asian Paints Q4 FY25 Financial Analysis: Detailed Investor Insights
125- Pidilite Industries Q4 FY25 Financial Analysis
126- Larsen & Toubro (L&T) Q4 FY25 & FY25 Financial Analysis
127- 📊 Titan Company Ltd. Q4 FY25 & FY25 Financial Performance Analysis
128- Affle 3I Q4 & FY25 Results: Strong Growth
129- Divi's Laboratories Q4 & FY25 Results: ₹2,209 Cr Profit, ₹30 Dividend, CMP ₹6,539 | Long-Term Outlook & Valuation
130- ITC Hotels Q4 & FY25 Results: 73% Profit Growth | ₹202 CMP Valuation & Expansion Outlook
131- Patanjali Foods Q4 FY25 Results: 70% PAT Growth | Highest Ever Revenue Achieved
132- Jubilant FoodWorks Q4 & FY25 Results: Delivery Growth, Store Expansion & Financial Insights
133- 🚗 MapmyIndia Q4 FY25 & FY25 Results: Strong Momentum in Tech & Mobility
134- 🧾 Page Industries Q4 & FY25 Result Update Brand:
135- 🇮🇳 Bharat Electronics Ltd – Q4 & FY25 Financial Results & Investor Insights 🔍
136- 🔬 PI Industries Ltd – Q4 & FY25 Results Review | Growth, Margins, and Outlook
137- 📊 Dixon Technologies (India) Ltd – Q4 FY25 & FY25 Financial Results Analysis
138- 🧬 Dr. Lal PathLabs Q4 & FY25 Results: Strategic Growth Beyond Metro Markets
139- 🛫 IndiGo Q4 FY25 Results: Record Profits, Rising Passengers & Strong Outlook
140- 🚜 Balkrishna Industries Ltd – Q4 & FY25 Results Update: Strong Long-Term Strategy Despite Soft Q4
141- Info Edge (India) Ltd. Q4 FY25 & FY25 Results Analysis: Detailed Investor Insights
142- 📊 Bajaj Auto Q4 FY25 & FY25 Financial Highlights: Growth, Resilience, & Green Momentum
143- IRCTC Q4 & FY25 Results: Insights for Investors
144- 🚢 Mazagon Dock Q4 & FY25 Results:
145- 🏥 Apollo Hospitals FY25 Results: Strong Performance Backed by Expansion Plans
146- 📊 TCS Q1 FY26 Financial Performance: Comprehensive Investor Guide
147- United Breweries Ltd (UBL) Q4 & FY25 Results Analysis: Brewing Growth with Consistency
148- Q1 FY26 Financial Analysis of IREDA
149- Tata Elxsi Q1 FY26 Financial Results: Comprehensive Analysis
150- 🏪 DMart Q1 FY26 Financial Results: Stable Growth Amid Margin Pressure
151- HDFC Life Q1 FY26 Results: Strong Momentum Continues in Life Insurance
152- ICICI Lombard General Insurance Q1 FY26 Results Analysis: Stable Growth Amid Regulatory Changes
153- ITC Hotels Q1 FY26 Results: Record Performance, Robust Growth, and Long-Term Outlook
154- L&T Technology Services Ltd (LTTS) Q1 FY26 Results: Investor Analysis
155- HDFC AMC Q1 FY26 Results Analysis: Strong Performance & Strategic Positioning
156- Reliance Q1 FY26 Results: Record-Breaking Profits & Multi-Engine Growth 🚀
157- HDFC Bank Q1 FY26 Results: Growth Resilient, Bonus Announced! 🚀🏦
158- 🚦 AU Small Finance Bank (AUBank) Q1 FY26 Results Analysis: Strengths & Concerns at CMP ₹795
159- 📊 Havells India Q1 FY26 Results Analysis at CMP ₹1532
160- 🏗️ UltraTech Cement Q1 FY26 Results: Strong Growth, Margin Recovery & Capacity Expansion 🚀
161- Eternal Limited (Zomato) Q1 FY26 Results: Revenue Surges 70%, Quick Commerce Leads Growth
162- 🏭 Kajaria Ceramics Q1 FY26 Results: Margins Improve Amidst Soft Demand 📊
163- 🚆 IRFC Q1 FY26 Results: Strongest-Ever Quarterly Performance! 📈
164- ⚡ IEX in Flux: Q1 FY26 Results Amid Market Coupling Shock
165- 📊 Dixon Technologies Q1 FY26: Strong Growth Amid Strategic Expansions
166- 🏠 Bajaj Housing Finance – Q1 FY26 Result Highlights
167- 📊 Tata Consumer Products – Q1 FY26 Results: Steady Topline, Margin Challenges
168- 📊 Bajaj Finance Q1 FY26 Results: Solid Growth, AI-led Efficiency, and Asset Quality Focus! 💼
169- 📊 Nestlé India Q1 FY26 Results Analysis
170- 🏭 Supreme Industries Q1 FY26 Results: Volume Up, Profit Down — What’s Next? 📊
171- 📊 CDSL Q1 FY26 Results: Marginal Growth in Revenue, Digital Strategy Intact 🧾🔍
172- 🧾 Balkrishna Industries Q1 FY26 Result Analysis 🛞
173- 📊 Affle Q1 FY26 Financial Performance: Resilient Growth with Focused Execution
174- Bharat Electronics Limited (BEL) Q1 FY26 Results Analysis 📊
175- Waaree Energies Ltd Q1 FY26 Results Analysis
176- Asian Paints Q1 FY26 Results: Analysis with Key Insights & Outlook 🏭🎨
177- 🚧 Larsen & Toubro Q1 FY26 Results – Record Order Book, Global Growth, and Margin Watch Ahead
178- 🚗 Maruti Suzuki Q1 FY26 Results – Steady Profit, Strong Exports, But Margins Under Pressure
179- 👔 Manyavar (Vedant Fashions Ltd) Q1 FY26 Results – Steady Growth Amidst Mixed Market Sentiments
180- ✈️ IndiGo Q1 FY26 Results – Navigating Headwinds, Flying Towards Growth!
181- Intrinsic Valuation & Wealth Building – After Class Review
182- 🎥 Session Replay (YouTube Live): Intrinsic Valuation & Wealth Building: Fair Value, Margin of Safety & Allocation Strategy
183- Godrej Properties Q2 FY2026 Analysis: Scaling New Heights 🏙️📈
184- ✈️ IndiGo Q2 FY26: Currency Turbulence vs. Operational Resilience
185- IREDA Q3FY26 Results: Green Energy Giant Hits Record Profits—Time to Buy?
186- DMart (Avenue Supermarts) Q3 FY26 Results Analysis: Margin Expansion Amidst Steady Growth
187- TCS Q3 FY26 Results Analysis: AI Momentum vs. Statutory Headwinds
188- Tata Elxsi Q3 FY26 Results Analysis: Healthy Margin Expansion Amidst Steady Revenue Growth
189- ICICI Lombard (ICICIGI) Q3FY26 Analysis: Navigating Industry Shifts with Resilience
190- HDFC AMC Q3 FY26 Results Analysis: Steady Growth Amid Industry Tailwinds
191- HDFC Life: Driving Protection Momentum in Q3 FY26
192- LTTS Q3FY26 Analysis: Strategic Pivot Towards "Engineering Intelligence"
193- Reliance Industries Q3 FY26 Financial Analysis & Investment Insights
194- AU Small Finance Bank Q3FY26 Results: A Deep Dive into 26% Profit Growth and Strategic Expansion
195- HDFC Bank Q3FY26 Analysis: Navigating the Glide Path with Disciplined Growth
196- Havells Q3 FY26 Analysis: Robust Revenue Growth Amidst Margin Headwinds
197- IRFC Q3FY26 Results: Record Profits and Strategic Pivot Under "IRFC 2.0"
198- ITC Hotels Q3FY26 Analysis: Record Revenues & Strategic Scalability
199- Supreme Industries Q3 FY26: Resilient Volumes Amid Pricing Headwinds
200- Eternal Limited Q3FY26 Results: Quick Commerce Turns Profitable!
201- Waaree Q3 FY26 Analysis: Record-Breaking Growth Fuels Aggressive 'Waaree 2.0' Expansion
202- IndiGo Q3FY26 Results Analysis: Navigating Turbulence with Resilient Fundamentals
203- UltraTech Cement Q3FY26 Results: A Masterclass in Operational Efficiency
204- What is the policy repo rate as decided by the Monetary Policy Committee in its February 2026 meeting?
205- Asian Paints Q3FY26: Resilience Amidst Competitive Intensity
206- Tata Consumer Q3FY26: Strong Volume Growth and Margin Expansion Steer Performance
207- Bharat Electronics Ltd (BEL): A High-Octane Q3 Performance Analysis
208- BKT Q3FY26 Results: Resilient Volume Rebound Amid Global Headwinds
209- L&T Q3 FY26 Analysis: A ₹7 Lakh Crore Milestone in Engineering Excellence
210- Maruti Suzuki Q3 FY'26 Results: A Deep Dive into "The GST Bounce Back"
211- Dixon Technologies Q3 FY26 Analysis: Transitioning to a Design-Led Component Giant
212- IEX Q3FY26 Results: Powering Through Energy Transitions
213- Voltas Q3 FY26 Results Analysis: Leadership Strengthened Amid Seasonality
214- Bajaj Auto Q3 FY26 Analysis: Record-Breaking Performance as Exports and EVs Scale New Peaks
215- Dr. Lal PathLabs Q3 FY26 Analysis: Steady Revenue Amidst Seasonal Headwinds & One-Off Costs
216- Nestle India Q3FY26 Results: Record Turnover and Five-Year High Volume Growth
217- Kajaria Ceramics Q3 FY26 Analysis: Efficiency Gains Meet Muted Demand
218- Affle 3i Limited Q3 FY2026 Analysis: AI-Driven Milestone Performance
219- CDSL Q3FY26 Analysis: Demat Dominance Continues Amidst Shifting Revenue Mix
220- Bajaj Housing Finance Ltd. (BAJAJHFL) Q3 FY26 Results Analysis
221- Bajaj Finance Q3 FY26 Analysis: Robust AUM Scaling vs. Rising Cost of Funds
222- Pidilite Q3 FY26 Consolidated Analysis: Volume-Led Mastery Amidst Input Cost Tailwinds
223- Wonderla Holidays Ltd. Q3 FY26 Analysis: Record Revenue vs. Margin Pressure from New Launches
224- Godrej Properties Q3 FY26 Analysis: Blockbuster Pre-Sales vs. Operational Revenue Paradox
225- Page Industries Q3 FY26 Analysis: Steady Growth Meets One-Time Regulatory Hurdles
226- Mazagon Dock Shipbuilders Q3 FY26 Analysis: Order Book Execution vs. Margin Normalization
227- State Bank of India Q3 FY26 Analysis: Credit Engine Fires Up vs. Margin Compression Concerns
228- Apollo Hospitals Q3 FY26 Analysis:
229- Titan Company Q3 FY26 Analysis: Dominant Revenue Surge vs. Margin Compression Tailwinds
230- Jubilant FoodWorks Q3 FY26 Analysis: Robust Topline Growth vs. Margin Compression Challenges
231- Amara Raja Energy & Mobility Q3 FY26 Analysis: New Energy Resilience vs. Profitability Headwinds
232- LG Electronics India Q3 FY26 Analysis: Premium Momentum vs. High-Base Moderation
233- Patanjali Foods Q3 FY26 Analysis: Record Revenue Surge vs. Operating Margin Pressure
234- Divi's Laboratories Q3 FY26 Analysis: Custom Synthesis Resilience vs. Margin Pressure from Labor Transitions
235- IRCTC Q3 FY26 Analysis: Robust Ticketing Momentum vs. Tourism Segment Volatility
236- PI Industries Q3 FY26 Analysis: Navigating a Challenging Global Cycle
237- Manyavar (Vedant Fashions) Q3 FY26 Analysis: Robust Margin Retention vs. Moderating Same-Store Growth
238- Info Edge (Naukri) Q3 FY26 Analysis: Recruitment Resilience vs. Non-Recruitment Cash Burn
239- EMS Limited Q3 FY26 Analysis: Order Book Resilience vs. Bottom-line Pressure
240- MapmyIndia (C.E. Info Systems) Q3 FY26: Seasonal Headwinds vs. Record Order Book
241- Q3fy26_Results Update for 55 Focused Companies Spread Sheet
242- Q3 FY26 Earnings Masterclass: The Turning Point for Indian Corporates
243- Trent Limited Q3 FY26 Analysis: Aggressive Expansion vs. Bottom-line Normalization
244- NIIT Learning Systems Q3 FY26 Analysis: Scaling AI-Led L&D vs. Margin Dilution Risks
245- Bharti Airtel Q3 FY26 Analysis: Premiumization Lead vs. High Capex Intensity
246- HAL Q3 FY26 Analysis: Execution Momentum vs. Rising Employee Liabilities
247- Siemens Energy India (ENRIN) Q1 FY26 Analysis: Robust Backlog Execution vs. Elevated Valuations & One-Off Labor Costs
248- ABB India Q4 CY2025 Analysis: Record Order Inflows vs. Margin Headwinds
249- Siemens Limited Q5 FY25 Analysis: Structural Tailwinds vs. Capital Allocation Discipline
250- Polycab Q3 FY26 Analysis: Record Top-line Growth vs. Margin Compression
251- Solar Industries Q3 FY26 Analysis: Record Defense Execution vs. Sluggish Domestic Mining
252- Mahindra & Mahindra Q3 FY26 Analysis: Breakthrough Services vs. Commodity Inflation Headwinds
253- Cummins India Q3 FY26 Analysis: Steady Domestic Growth Meets Export Headwinds
254- Timken India Limited Q3 FY26 Analysis: Revenue Resiliency vs. Transitional Margin Pressure
255- 🚜 Investment Report: Construction Vehicles Industry
256- TCS Q4 FY26 Analysis: The AI Growth Engine vs. Macro Headwinds
257- Action Construction Equipment (ACE) Q3 FY26 Analysis: Margin Mastery vs. Volume Headwinds
258- Netweb Technologies Q3 FY26 Analysis: AI Tsunami vs. Supply Chain Headwinds
259- ICICI Lombard Q4 FY26 Analysis: Growth Momentum vs. Loss Ratio Headwinds
260- HDFC AMC Q4 FY26 Analysis: Market Share Gains vs. Yield Pressure
261- HDFC Life Q4 FY26 Analysis: Robust Premium Growth vs. Regulatory Margin Pressures
262- CRISIL Q1 FY26 Analysis: 46% Profit Surge vs. Dynamic Operating Costs
263- HDFC Bank Q4 FY26 Analysis: Liquidity Rebound vs. Margin Compression Resistance
264- Nestlé India Q4 FY26 Analysis
265- Tata Elxsi Q4 FY26 Analysis: Resilient Revenue Growth vs. The Exceptional Cost Hurdle
266- Havells India Q4 FY26 Analysis: Steady Cable Demand vs. The Summer Letdown
267- IEX Q4 FY26 Analysis: Record Volumes vs. Regulatory Overhang
268- Trent Limited Q4 FY26 Analysis: Aggressive Expansion vs. Consumption Softness
269- Reliance Industries Q4 FY26 Analysis: Telecom & Retail Resilience vs. O2C Margin Headwinds
270- UltraTech Cement Q4 FY26 Analysis: Historic 200 MTPA Milestone vs. Geopolitical Cost Headwinds
271- Bajaj Housing Finance Q4 FY26 Analysis: Record Earnings vs. Margin Pressure
272- AU Small Finance Bank Q4 FY26 Analysis: Universal Ambitions vs. NIM Pressure
273- Supreme Industries Q4 FY26 Analysis: Volume Leadership vs. Margin Expansion
274- Maruti Suzuki Q4 FY26 Analysis: Record Top-line Growth vs. Margin Pressure
275- Eternal Limited (formerly Zomato Ltd)
276- Bajaj Finance Q4 FY26 Analysis: Milestone AUM Growth & Robust Topline Performance
277- Waaree Energies Q4 FY26 Analysis: Blockbuster Topline Growth vs. Contracting Margins
278- Dr. Lal PathLabs Q4 FY26 Analysis: Volume-Led Growth vs. Rising Competitive Intensity
279- Kajaria Ceramics Q4 FY26 Analysis: Volume Resilience vs. Realization Headwinds
280- Mazagon Dock Q4 FY26 Analysis: Order Execution Powerhouse vs. Depleting Order Backlog
281- CDSL Q4 FY26 Analysis: Robust Account Additions vs. Surging IT & Compliance Costs
282- Avenue Supermarts (DMart) Q4 FY26 Analysis: Relentless Expansion vs. Normalizing Margin Efficiencies
283- Computer Age Management Services (CAMS) Q4 FY26 Analysis: Expanding Non-MF Moat vs. Regulatory Yield Compression
284- Godrej Properties (GODREJPROP) Q4 FY26 Analysis: Record Pre-Sales Surge vs. Execution Delays
285- Larsen & Toubro (L&T) Q4 FY26 Analysis: Record Execution Scale vs. Enduring Manpower Bottlenecks
286- Mahindra & Mahindra Q4 FY26 Analysis
287- Bajaj Auto Q4 FY26 Analysis
288- Polycab India Q4 FY26 Analysis
289- BSE Limited Q4 FY26 Analysis: Unprecedented F&O Traction vs. Elevated Regulatory Constraints
290- Wonderla Holidays Q4 FY26 Analysis: Premiumisation and Chennai Expansion vs. Climate Risks and Labor Codes
291- Pidilite Industries Ltd Q4 FY26 Analysis: Volume-Led Margin Expansion vs. Export Sluggishness & VAM Volatility
292- Balkrishna Industries (BKT) Q4 FY26 Analysis: Record Volume Expansion vs. Margin Contraction
293- Titan Company Q4 FY26 Analysis: Massive Revenue Surge vs. Operating Margin Pressures
294- ABB India Q1 CY2026 Analysis: Order Book Hits Record ₹11,000 Cr as Margins Suffer from Commodity Shock
295- Tata Consumer Products Q4 FY26 Analysis: Robust Margin Expansion vs. International Geopolitical Headwinds
296- Vedant Fashions Limited Q4 FY26 Analysis: Margin Resilience vs. Sluggish Store Expansion
297- Affle 3i Limited Q4 FY2026 Analysis: Resilient AI-Led Growth vs. Gross Margin Compression
298- State Bank of India (SBIN) Q4 FY26 Analysis: Historic Asset Quality vs. Unrelenting Margin Pressures
299- Dixon Technologies Q4 FY26 Analysis: Strong FY26 Finish vs. Near-Term Mobile Headwinds
300- NIITMTS Q4 FY26 Analysis: AI-Driven Strategic Pipeline vs. Macro-Induced Budget Pullbacks
301- Bharti Airtel Q4 FY26 Analysis: Strong Operational Momentum vs. ARPU Headwinds
302- HAL Q4 FY26 Analysis: Decisive Order Book Expansion vs. Engine-Supply Bottlenecks
303- Indian Railway Finance Corporation (IRFC) Q4 & FY26 Analysis: High-Margin Diversification Gains vs. Flat Quarterly Profit Growth
304- Voltas Limited Q4 FY26 Analysis: Progressive Volume Recovery vs. Sticky Margin Compression
305- ITC Hotels Q4 FY26 Analysis: Accelerating 'Asset-Right' Scale vs. Geopolitical Demand Headwinds
306- Solar Industries India Limited Q4 FY26 Analysis
307- Timken India Q4 FY26 Analysis: Historic Revenue Breakout vs. Margin Contraction Pressures
308- C.E. Info Systems Ltd (MapmyIndia) Q4 & FY26 Analysis: Decisive Q4 Sequential Inflection vs. Elongated Working Capital Cycles
309- Bharat Electronics Ltd (BEL) Q4 FY26 Analysis: Stellar Full-Year Revenue Beat vs. Near-Term Margin Contraction
310- PI Industries Q4 FY26 Analysis: Pharma CRAMS Resurgence vs. Agrochemical Downcycle Headwinds
311- Action Construction Equipment Ltd (ACE) Q4 FY26 Analysis: Robust Agriculture & Defence Ramping vs. Steel Inflation & Geopolitical Pressures
312- Apollo Hospitals Enterprise Ltd (APOLLOHOSP) Q4 FY26 Analysis: Robust Healthcare Services Growth vs. Digital Integration and Bed Expansion Costs
313- Jubilant FoodWorks Ltd Q4 FY26 Analysis: Stellar International Scale-Up vs. Near-Term Margin Inflation
314- LG Electronics India Q4 & FY26 Analysis: Record Revenue Scaling vs. EBITDA Margin Pressures
315- Page Industries Ltd Q4 FY26 Analysis: Robust Volume-Led Recovery vs. Persisting Input Inflation
316- Kwality Wall's (India) Q4 FY26 Analysis: Post-Demerger Scale vs. Profitability Squeeze
317- Info Edge (India) Ltd Q4 FY26 Analysis: Core Profitability Sustains Amidst Strategic Scaling
318- Netweb Technologies India Limited: Q4 & FY26 Performance Analysis
319- Siemens Energy India Limited (ENRIN): H1 FY26 Performance Analysis
320- NTPC FY26 Results: Why the Green Energy Pivot is a Game Changer for Investors.
321- Divi's Laboratories (DIVISLAB) Q4 FY26 Analysis: Custom Synthesis Moat vs. Supply Chain Headwinds
322- TCS Q1 FY27 Analysis: Scaling AI-Led Growth vs. Persistent Macro Headwinds
323- Amara Raja Energy & Mobility Q4 FY26 Analysis