PI Industries Q4 FY26 Analysis: Pharma CRAMS Resurgence vs. Agrochemical Downcycle Headwinds
The global agrochemical sector is navigating one of its deepest cyclical downturns in recent memory. Distributors worldwide are aggressively clearing overstocked channel inventories, and intense generic competition from Chinese players has pushed chemical prices down significantly.
As a primary custom synthesis and manufacturing (CSM) partner to global agrochemical innovators, PI Industries Limited (PIIND) has not been immune to these headwinds. However, a closer look at the Q4 FY26 performance reveals a dual story: a persistent downcycle in the core Agchem exports, offset by phenomenal momentum in the nascent Pharma contract research and development organization (CRDMO) business.
Here is our comprehensive, "margin of safety" institutional deep dive into PI Industries’ Q4 FY26 performance, structural transformations, and valuation guardrails.
1. The Snapshot
2. The 'Wow' Factor: Impactful Takeaways
Surprising Gross Margin Resilience: Despite a $12.42\%$ YoY decline in revenue, consolidated gross margins expanded by $277\text{ bps}$ YoY to $58.0\%$ in Q4 FY26. For the full year FY26, gross margins expanded by a whopping $507\text{ bps}$ to $58.0\%$, driven by a favorable product mix (higher contribution of newer, high-complexity molecules) and sharp operational cost controls.
The Pharma Growth Engine is Real: PI Health Sciences (PIHSL) delivered a stellar $40\%\text{ YoY}$ revenue growth for the full year FY26, with Q4 FY26 pharma revenue climbing $23.3\%\text{ YoY}$ to ₹104.8 Cr. It now represents approximately $6\%$ of total export revenues, serving as a critical strategic hedge.
The Operating Cash Flow Collapse: Driven by inventory build-ups and customer payment schedule adjustments, Net Operating Cash Flow plummeted $66.45\%\text{ YoY}$ to ₹474.0 Cr in FY26, down from ₹1,412.9 Cr in FY25. This indicates significant working capital pressure.
Exceptional Mask on Net Profit: The full-year consolidated Net Profit of ₹1,320.8 Cr was aided by a net exceptional gain of ₹103.1 Cr (primarily due to a ₹126.0 Cr writeback of contingent consideration from previous pharma acquisitions, partially offset by a ₹22.9 Cr provision for the New Labor Code).
3. Operational KPI Tracker
To understand the core engine of PI Industries, we track key operating metrics across its primary segments:
$$\text{Total Consolidated Revenue} = \text{Agrochemical Revenue} + \text{Pharma Revenue}$$
Key Takeaway: While domestic volumes actually grew $+3\%$ YoY in Q4, steep industry-wide price erosion and channel inventory corrections dragged down the overall segment revenues.
4. Financial Deep Dive: Consolidated Performance
$$\text{EBITDA Margin} = \left( \frac{\text{EBITDA}}{\text{Revenue from Operations}} \right) \times 100$$
$$\text{Net Profit Margin} = \left( \frac{\text{PAT}}{\text{Revenue from Operations}} \right) \times 100$$
Cost vs. Efficiency Analysis
The EBITDA margin contraction of $401\text{ bps}$ YoY in Q4 FY26 highlights that gross margin gains were entirely absorbed by higher fixed overheads. Total overheads rose $8\%$ YoY to ₹568.4 Cr in Q4, driven by scale-up costs in the Pharma segment and employee additions in R&D.
Furthermore, the sharp $35.69\%$ QoQ drop in PAT (from Q3 to Q4) was exacerbated by a significant jump in the Effective Tax Rate (ETR) to $33.42\%$ in Q4 FY26 (tax expense of ₹100.3 Cr on PBT of ₹300.1 Cr), up from $14.23\%$ in Q3. This was due to higher business shares coming from non-SEZ manufacturing facilities.
5. Management Integrity and Tone
Analyzing the management transcript of the Q4 FY26 earnings call, we rate the tone as Transparent but Defensive.
On Industry Cyclicality (Mayank Singhal): Management did not sugarcoat the challenges. They acknowledged the severe price pressure from generic suppliers and deferred customer schedules.
On Capital Allocation Priorities: Analysts pressed hard on why PI deferred the commercialization of newer multi-product plants (MPPs). Management was defensively pragmatic, explaining that executing aggressive capex during an oversupplied cycle would hurt Asset Turnover and ROE:
$$\text{Asset Turnover} = \frac{\text{Net Revenue}}{\text{Average Net Block}}$$
The Regulatory Watch-Out: The domestic Biologicals business continues to experience regulatory transitions. Management is repositioning the portfolio toward biosolutions, but growth in Q4 remained flat.
6. Peer Benchmarking: Navigating the Winter
To gauge PI Industries' relative strength, we compare its performance against its closest CRAMS/Specialty Chemical peers in Q4 FY26:
Benchmark Insights: UPL and Anupam Rasayan showed strong volume-led topline recovery, indicating that global demand volume is returning. However, PI Industries' focus on protecting margins over aggressively pursuing low-margin volumes kept its gross margin superior ($58\%$) compared to peers, even as it sacrificed near-term revenue growth. Crucially, PI's balance sheet remains the cleanest, with virtually zero net debt and surplus cash of ₹3,426.5 Cr.
7. Major Shareholding Movements
During the latter half of FY26, we observed institutional hands changing:
Foreign Institutional Investors (FIIs): Reduced stake from $16.4\%$ (September 2025) to $15.9\%$ (March 2026) amid generalized emerging market capital outflows and chemical sector re-allocations.
Domestic Institutional Investors (DIIs): Steadily absorbed the selling, increasing their holding from $30.3\%$ to $31.2\%$ over the same period.
Promoter Holding: Maintained stable at $46.1\%$ with zero promoter shares pledged, reassuring long-term investors of promoter alignment.
8. Valuation Guardrails & The Forward Curve
The Forward Curve (Next 2 Quarters Outlook)
Management has guided for a conservative high-single-digit consolidated revenue growth for FY27, heavily back-ended toward H2 FY27.
Q1 FY27 Projections: Revenues are expected to remain flat to marginally positive ($+2\%$ to $+4\%$ YoY) as the final leg of customer inventory destocking concludes.
Pharma Target: Management reiterated their target of scaling Pharma revenues to ₹500–600 Cr over the next 2 years, doubling the current run-rate.
Valuation Scorecard
$$\text{Current PE} = \frac{\text{CMP}}{\text{FY26 EPS}} = \frac{₹2,821}{₹86.89} = 32.46\text{x}$$
Historical 5-Year Median PE: $45.2\text{x}$
Valuation Verdict: Historically Discounted. Trading at a P/E of $32.46\text{x}$ relative to its 5-year average of over $45\text{x}$, the market has significantly discounted the agchem downcycle. This provides a robust Margin of Safety for long-term investors.
9. The Advisory Note: Strategic vs. Tactical
Strategic Long-Term Thesis (The Buy-and-Hold view): PI Industries remains a structural winner. Its deep-rooted partnerships with global agchem innovators cannot be easily replicated by generic chemical manufacturers. The clean cash balance sheet allows the company to fund its Pharma CRDMO scale-up internally without dilutive debt. We believe the chemical winter will eventually yield to spring, and PI is positioned to capture a disproportionate share of the recovery.
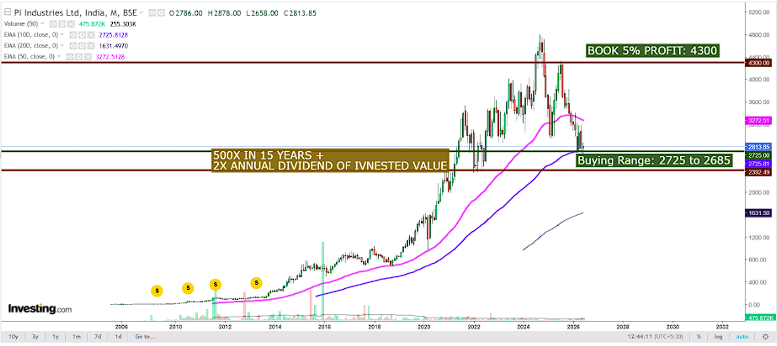
Tactical Near-Term View (The Trading Opportunity): Near-term stock price momentum will likely remain sideways or volatile until export order volumes show visible upward revisions in Q1 and Q2 FY27. Investors should use temporary price corrections toward the 52-week low of ₹2,700 to accumulate.
Fairvale:
Mandatory Financial Disclosure
Disclaimer: We are Corporate Investment Advisors. This analysis is for educational and informational purposes only and does not constitute formal investment advice. PI Industries is a highly cyclical stock.

