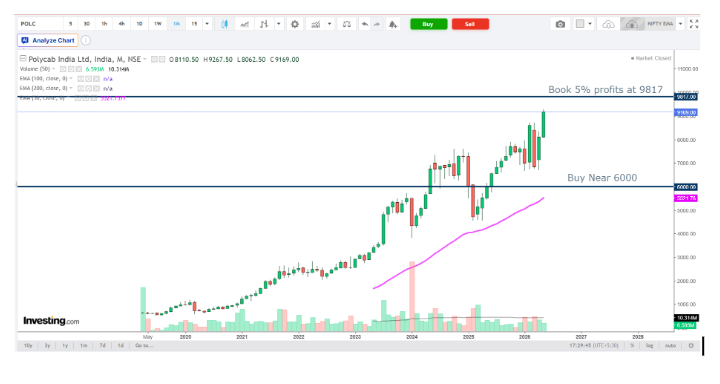
Polycab India Q4 FY26 Analysis: Robust Market Share Gains vs. Margin Normalization
📌 TL;DR for the Busy Investor
Revenues skyrocketed: Polycab breached the ₹285 Bn mark for FY26 (up 29% YoY).
Market Share push: Successfully grabbed 3-4% more of the domestic market pie.
The Catch: Q4 PAT grew only 7% YoY against a 27% revenue jump, pointing to rising costs and margin compression.
Valuation: Trading at a steep PE of ~51.8x, leaving little room for error.
At our advisory firm, we consistently emphasize the importance of looking beyond the top-line hype to evaluate the underlying mechanics of growth. Polycab India Ltd recently released its Q4 and full-year FY26 results, reporting record-breaking revenues. However, as disciplined investors, we must ask: at what cost did this growth come, and does the current valuation offer a sufficient margin of safety?
Let’s dive into the core fundamentals of Polycab's Q4 FY26 performance.
📊 The Snapshot
🖼️ Visual Suggestion: A clean, modern "Tear-sheet" graphic replacing this table. Use green for positive metrics and a cautious yellow for the verdict.
🌟 The 'Wow' Factor
The management delivered several striking data points this quarter:
🚀 Historic Milestone: FY26 consolidated revenue surpassed the monumental ₹285 Bn mark, clocking in at ₹2,88,838 Mn (up 29% YoY).
🎯 Market Share Aggression: The company successfully expanded its domestic market share by an impressive 3-4% over the year, driven by "Project Spring."
💰 Record Profitability: Full-year PAT crossed ₹27 Bn, representing a robust 32% YoY growth.
⚙️ Operational KPI Table
To understand where the operational leverage lies, we break down the segment-level profitability:
🔍 Financial Deep Dive: Cost vs. Efficiency
Here is the consolidated financial breakdown for Q4 FY26:
Note: Q3/Q4 FY25 figures are derived baseline estimates based on reported growth rates.
Cost vs. Efficiency Analysis
While the 27% YoY revenue growth in Q4 FY26 is phenomenal, we note a stark divergence in profitability growth. EBITDA grew by only 13% YoY, and PAT eked out a 7% YoY gain. This implies that costs are escalating faster than revenues.
$$\text{Q4 FY26 EBITDA Margin} = \left( \frac{11,613}{88,645} \right) \times 100 \approx 13.1\%$$
This is a noticeable dip compared to the ~14.7% margins we've seen in peak previous quarters. The management’s aggressive market share acquisition strategy—while successful—requires elevated spending on A&P (Advertising & Promotions) and competitive pricing.
Our Takeaway: From a margin of safety perspective, we remain critical of this margin compression. Unchecked cost growth in a cyclical industry can become a structural red flag if macroeconomic tailwinds slow down.
🎙️ Management Tone & Integrity
The tone of the management, led by CFO Niyant Maru, was highly confident and assertive. They highlighted that FY26 was a "defining year" and repeatedly emphasized the success of their strategic "Project Spring." Transparency was adequate, though the focus remained heavily skewed towards absolute growth numbers rather than margin preservation.
📈 The Forward Curve
Based on management guidance and strong channel checks, we project top-line momentum to continue over the next two quarters (Q1 and Q2 FY27).
Revenue Expectation: 18-22% YoY growth, riding the domestic infrastructure boom.
Margin Expectation: EBITDA margins range-bound between 13.0% and 13.5% as they defend newly acquired market share.
⚖️ Valuation Guardrails: Peer Benchmarking
How much are you paying for this growth?
🖼️ Visual Suggestion: A "Valuation Thermometer" graphic or a simple Bar Chart comparing Polycab's current PE to its historical median and KEI.
Polycab Current P/E: ~51.8x
Polycab 5-Year Median P/E: ~40.5x
Peer Benchmark (KEI Industries) P/E: ~53.3x
Verdict: Trading at a Premium. Both Polycab and its closest competitor, KEI Industries, are trading at stretched valuations. Polycab is currently trading at a ~25% premium to its own 5-year historical median. While the strong ROCE (34.3%) justifies some premium, the current multiple leaves virtually zero room for error.
👥 Shareholding Pattern Dynamics
A quick look at the cap table reveals stable institutional backing:
Promoters: 61.50% (Slightly reduced over the past 3 years by ~4.7%, but still highly concentrated).
FIIs: Strong conviction at 18.21%.
DIIs/Mutual Funds: ~8.0%.
The sustained FII interest indicates global confidence in India's capex narrative, though the historical promoter dilution is a metric we will continue to track.
🛡️ The Advisory Note: Strategic vs. Tactical
♟️ Strategic (Long-Term Thesis): Polycab is a phenomenal compounding machine. The structural shift from unorganized to organized players, coupled with the B2B to B2C transition via FMEG, gives it a massive runway for the next decade.
🎯 Tactical (Price Opportunity): At ₹9,150, the stock is priced for perfection. Value-conscious investors might find the risk-reward ratio unfavorably skewed in the short term. We recommend holding the asset if already accumulated at lower levels, but we advise waiting for a broader market correction or margin stabilization before initiating fresh heavy positions. Maintain a strict margin of safety.
Mandatory Financial Disclosure: This report is for educational and informational purposes only and does not constitute registered investment advice. Equity investments are subject to market risks. The author and the firm may or may not hold positions in the mentioned securities.