HDFC Bank Q3FY26 Analysis: Navigating the Glide Path with Disciplined Growth
As a cornerstone of the Indian banking sector, HDFC Bank's performance is a key indicator of the industry's health. This analysis breaks down the key performance indicators from the bank's Q3 FY26 earnings report to provide a clear, data-driven picture of its current financial standing and the drivers behind the headline numbers.
--------------------------------------------------------------------------------
1. HDFC Bank's Q3 FY26 Financial Scorecard
HDFC Bank Q3 FY26 Standalone Performance
--------------------------------------------------------------------------------
2. Key Insights from the Quarter
Takeaway 1: Profitability Driven by Efficiency and Lower Provisions
At first glance, the bank's 11.5% year-over-year growth in Profit After Tax (PAT) to ₹186.5 billion (rounded to ₹187 billion in the report's summary) appears robust. However, a deeper look reveals that this bottom-line growth was not primarily driven by core income, as Net Interest Income (NII) grew by a modest 6.4%. Instead, the profit growth was significantly amplified by two factors: disciplined cost management, with operating expenses rising only 5.0% YoY, and a substantial 10.0% YoY decrease in provisions for bad loans. This operational leverage, combined with solid profitability ratios like a Return on Assets (RoA) of 1.92% and a core cost-to-income ratio of 39.2%, tells the story of a quarter defined by efficiency.
Takeaway 2: Asset Quality Remains a Pillar of Strength
HDFC Bank's pristine asset quality continues to be a key strength, directly enabling its higher profitability. The Gross NPA (GNPA) ratio was stable at a healthy 1.24% as of December 2025, with the ex-agri GNPA even lower at 0.97%. The Net NPA (NNPA) ratio was a mere 0.4%, underscoring a resilient risk management framework. Crucially, this stability allowed the bank to reduce its credit provisions by 10% compared to the same quarter last year. This reduction in credit costs provided a direct tailwind to the Profit After Tax, demonstrating how strong underwriting standards translate into tangible financial gains.
Takeaway 3: Steady Growth in Core Business, but Margins are Key
The bank's core balance sheet shows steady expansion, with Gross Advances growing 11.9% YoY to ₹28,446 billion and Total Deposits growing 11.6% YoY to ₹28,601 billion. However, the composition of this loan growth reveals important trends. Growth was led by segments like Business Banking (19.8% YoY), while the large retail loan book grew at a more subdued 6.9% YoY. This steady, albeit not spectacular, growth in the core business, combined with a Net Interest Margin (NIM) of 3.35%, explains the modest 6.4% NII growth. The bank's Capital Adequacy Ratio remains very strong at 19.9%, providing ample capacity for future growth, but the focus for investors will be on the trajectory of its margins.
--------------------------------------------------------------------------------
3. Key Profitability Ratios
The following ratios from Q3 FY26 provide a snapshot of the bank's profitability and shareholder value creation:
Return on Assets (RoA): 1.92%
Return on Equity (RoE): 13.9%
Core Cost-to-Income Ratio: 39.2%
Standalone Book Value Per Share: ₹367 (as of Q3 Dec'25)
--------------------------------------------------------------------------------
HDFC BANK Q3FY26: Strong Subsidiary Synergy Drives Consolidated Growth
While the standalone bank remains the core engine, HDFC Bank's vast ecosystem of successful subsidiaries significantly enhances its value proposition. The Consolidated Net Revenue for Q3 FY26 reached ₹811.1 billion, marking a robust 24.2% YoY growth, showcasing the power of the group's diversified financial services.
Subsidiary Performance Showcase
HDFC Bank’s key subsidiaries are leaders in their respective segments, contributing significantly to the group's bottom line and providing cross-selling opportunities.
HDB Financial Services (NBFC):
PAT: ₹6.4 billion.
NIM: Improved to 8.1%, reflecting better asset-liability management.
Scale: Servicing 22 million customers across 1,744 branches.
HDFC Life Insurance:
AUM: Reached ₹3.8 trillion, a 15% YoY increase.
Market Leadership: Maintained a 15% individual weighted received premium market share for 9MFY26.
PAT: ₹4.2 billion.
HDFC AMC (Mutual Fund):
Market Share: Commands an 11.4% share with a quarterly average AUM of ₹9.2 trillion.
Growth: Total income grew by 20% over the previous year to ₹12.3 billion.
HDFC ERGO (General Insurance):
PAT: Grew to ₹2.6 billion, compared to ₹1.0 billion in the prior year.
Solvency: Healthy solvency ratio at 219%.
HDFC Securities:
Revenue: ₹8.3 billion, with a 94.05% stake held by the Bank.
Valuation Suite (Consolidated)
Consolidated RoE: 14.4% (vs 13.9% standalone), showing that subsidiaries are accretive to return profiles.
Consolidated BVPS: ₹367 (Adjusted for bonus), providing a higher floor for long-term valuation compared to the standalone book.
Conclusion
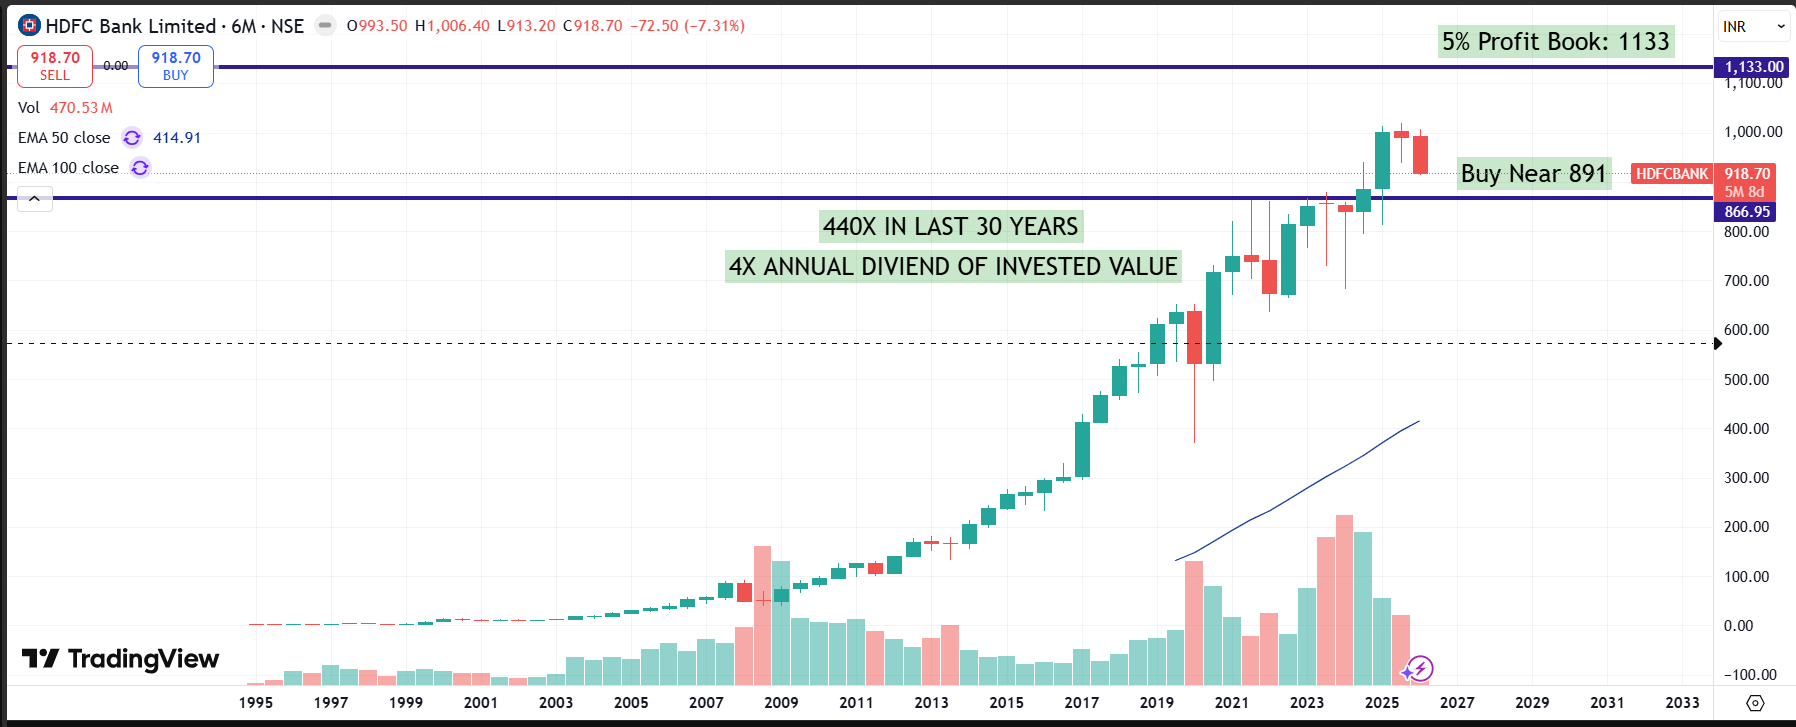
HDFC Bank's Q3 results showcase strong bottom-line growth of 11.5%, driven more by operational efficiencies and lower credit costs than by core income expansion, which was constrained by margin pressure. The bank continues to execute effectively, leveraging its sterling asset quality to boost profitability. With profitability currently buoyed by cost control and lower provisions, the key question for investors is: what will reignite core NII growth and expand margins in the coming quarters?
To understand how to evaluate companies like HDFC Bank for your portfolio, explore Step 4: Valuation in our Wealth-Building Strategy. The Fair Value is available at https://docs.google.com/spreadsheets/d/e/2PACX-1vRg1tSKFe-u3gKrsjyojpraa0BgCp8uc91CDC5EW5wLCHb_RJ8_6sbNVHNBNtQ6Ww/pubhtml
--------------------------------------------------------------------------------
Disclosure
Disclaimer: This article is for informational and educational purposes only and should not be considered as direct investment advice. The analysis is based on the Q3 FY26 investor presentation released by HDFC Bank. Financial markets are subject to risks, and readers are advised to conduct their own research before making any investment decisions. The author is a SEBI registered investment advisor.